

Question 1
Graphing calculator required
The temperature inside an industrial oven is modelled by
,
where is measured in degrees Celsius and is measured in minutes. The graph of is shown. Unless otherwise stated, round numerical answers to three decimal places.
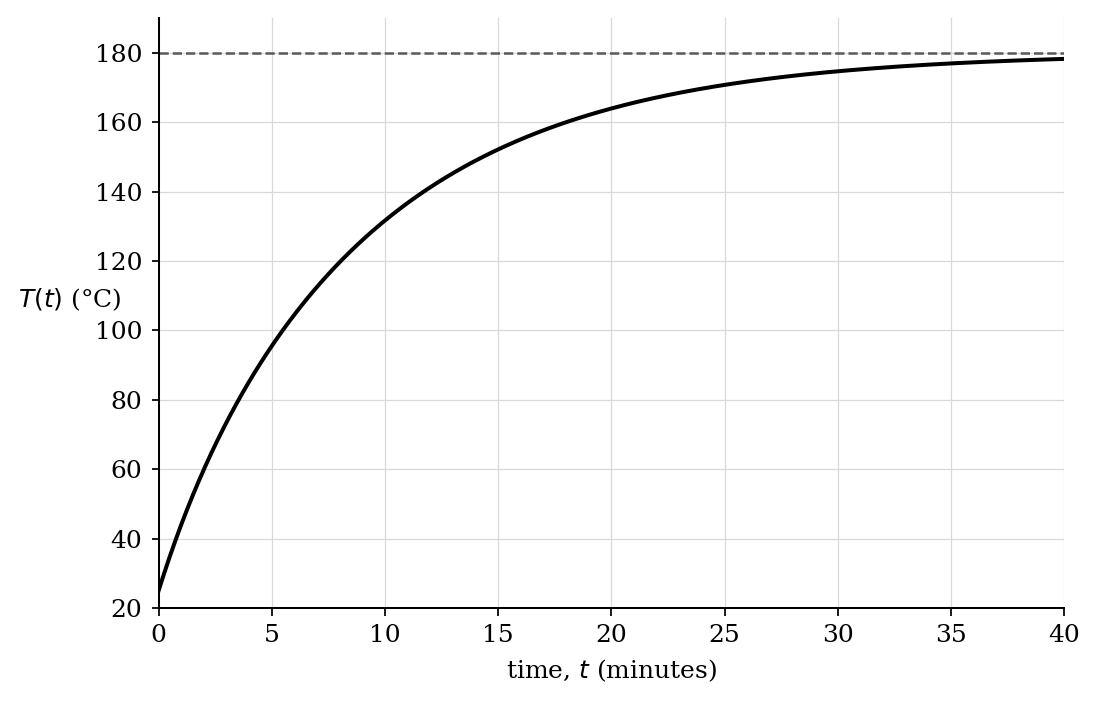
Write an expression for the limiting temperature by evaluating .
Interpret this limit in the context of the oven.
Calculate the first time at which the oven temperature reaches . Show the equation solved.
Calculate the average rate of change of the temperature from to . Include units.
Determine whether the oven temperature at is within of its limiting temperature. Justify your answer with a calculation.
Estimate the earliest time after which the temperature remains above .
Question 2
Graphing calculator not permitted
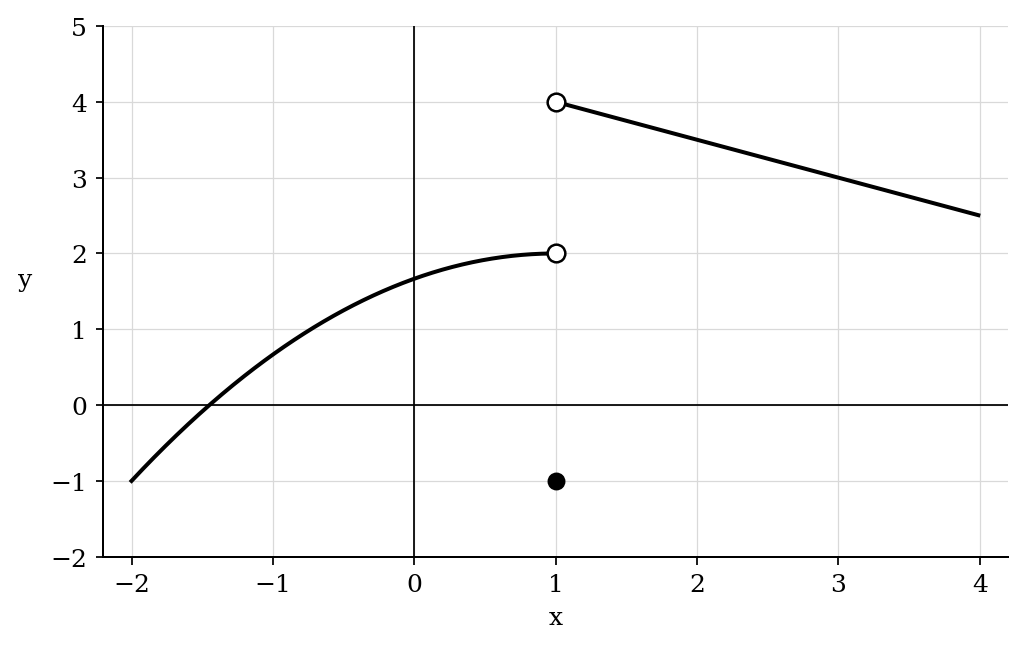
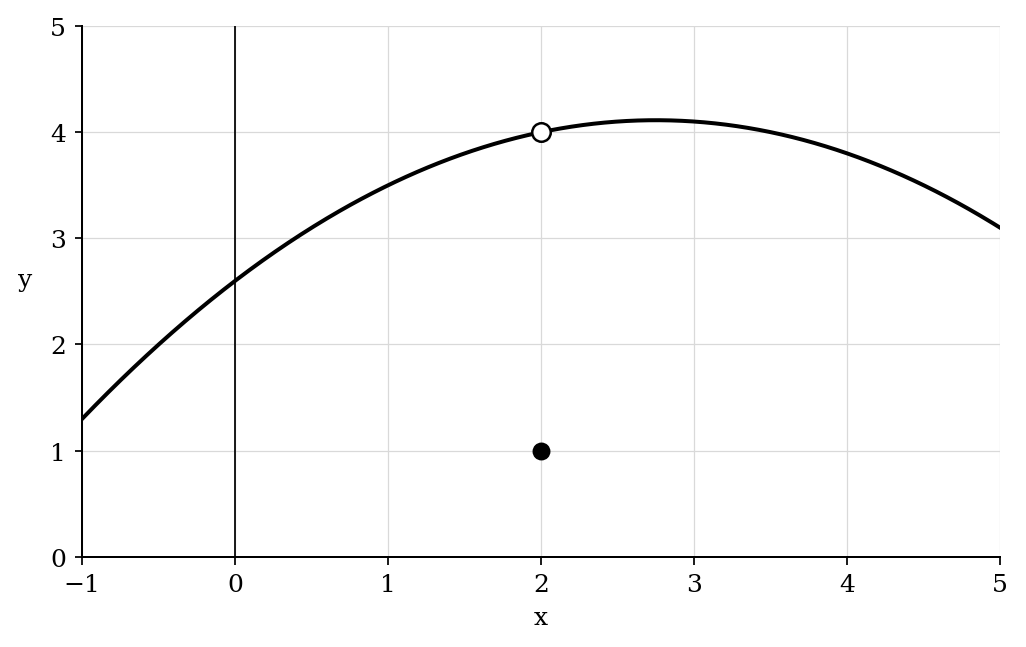
The graph of is shown. What is the value of
?
A.
B.
C.
D. The expression does not exist.
Question 3
Graphing calculator required
The functions
and
are continuous on . Their graphs are shown. For a number satisfying , define
Round calculator results to three decimal places.
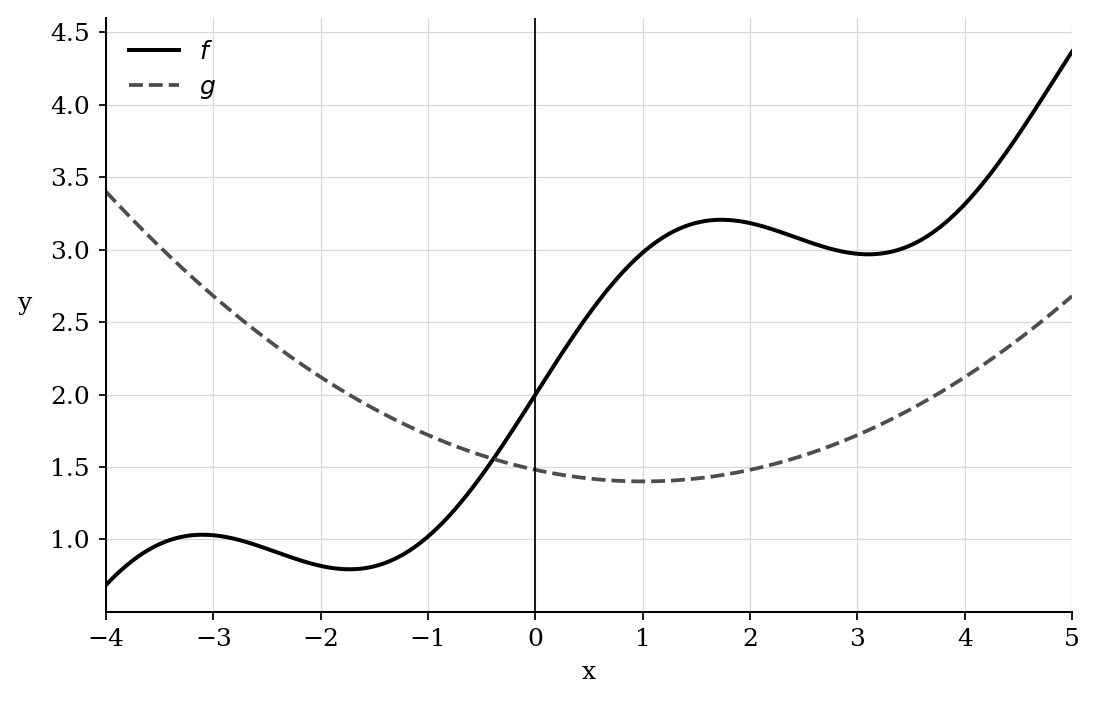
Represent and in terms of and .
Determine the condition that must be satisfied for to be continuous at .
Calculate all values of in for which is continuous. Show the equation solved.
For , determine whether exists. Justify your answer numerically.
Explain why every solution obtained in part (b) produces continuity at , rather than merely equal one-sided estimates from the displayed graph.
Question 4
GRAPHING CALCULATOR NOT PERMITTED
Let for . What is ?
A.
B.
C.
D. The limit does not exist.
Question 5
Graphing calculator not permitted
For , let
.
The graph of is shown together with the graphs of and on .
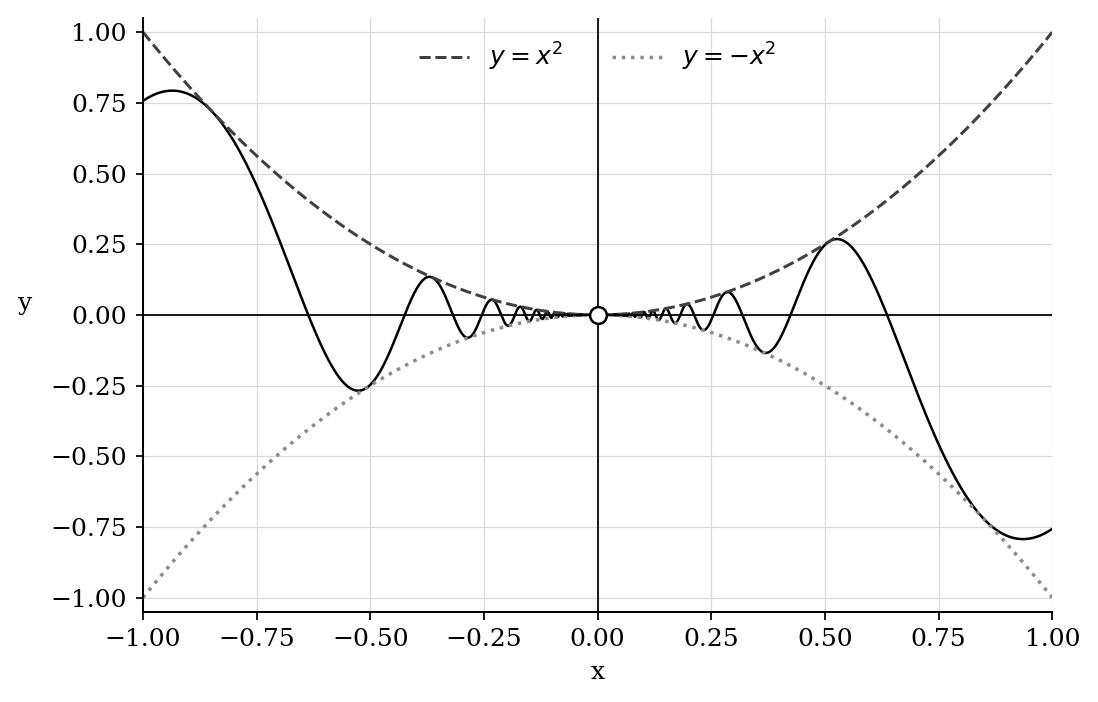
Verify that
for every .
Evaluate and .
Justify the value of using an appropriate theorem.
Define
Determine the value of that makes continuous at .
Verify that the three conditions for continuity at are satisfied for this value of .
Question 6
Graphing calculator not permitted
A water-level sensor reports a reading , in metres, over the time interval , where is measured in hours. The sensor output is continuous along each drawn curve or line segment. Open circles are not included function values, while filled points are included.
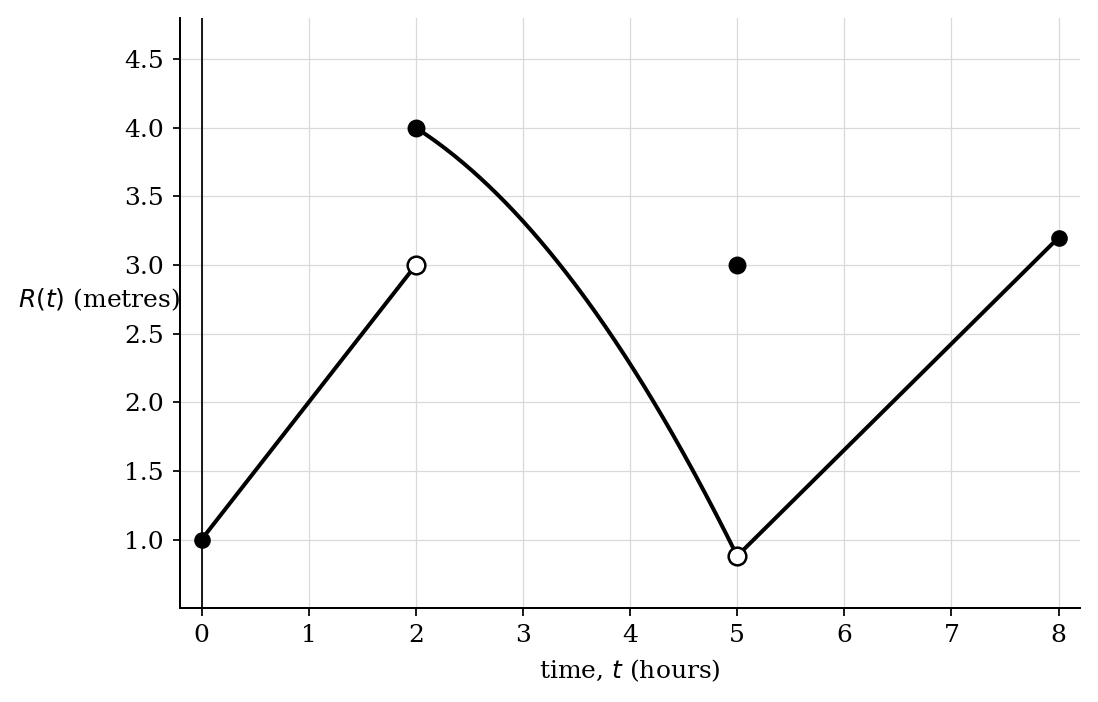
Estimate and .
Determine the type of discontinuity at . Justify your classification.
Estimate .
Determine the value that should replace to remove the discontinuity.
Verify that the redefined function is continuous at .
After the repair in part (b), determine the maximal intervals on which the sensor function is continuous.
Justify that there is at least one time in at which .
Question 7
Graphing calculator not permitted
The graphs of functions and are shown. Both functions have removable discontinuities at . The filled circle represents , and the filled square represents .
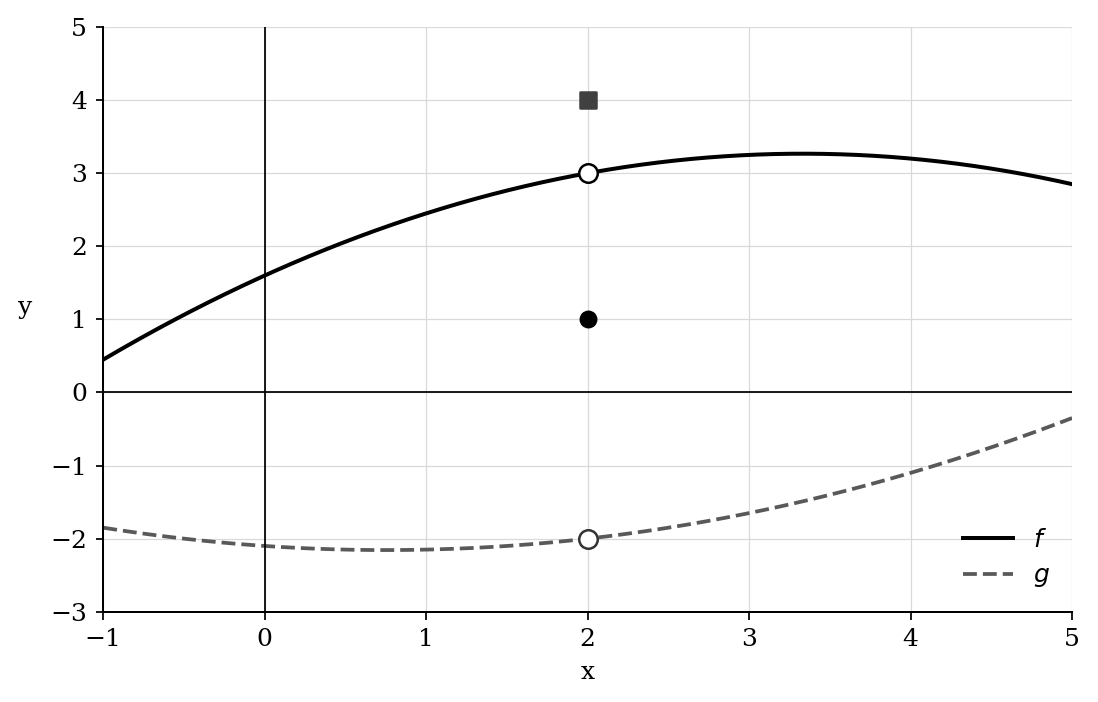
Calculate .
Calculate and verify that the quotient limit law applies.
Define
Determine the value of that makes continuous at .
Determine whether
.
Calculate both quantities and explain your conclusion.
Question 8
Graphing calculator not permitted
The graph of a function is shown. The dashed lines are asymptotes of . Define
at every value of for which this expression is defined.
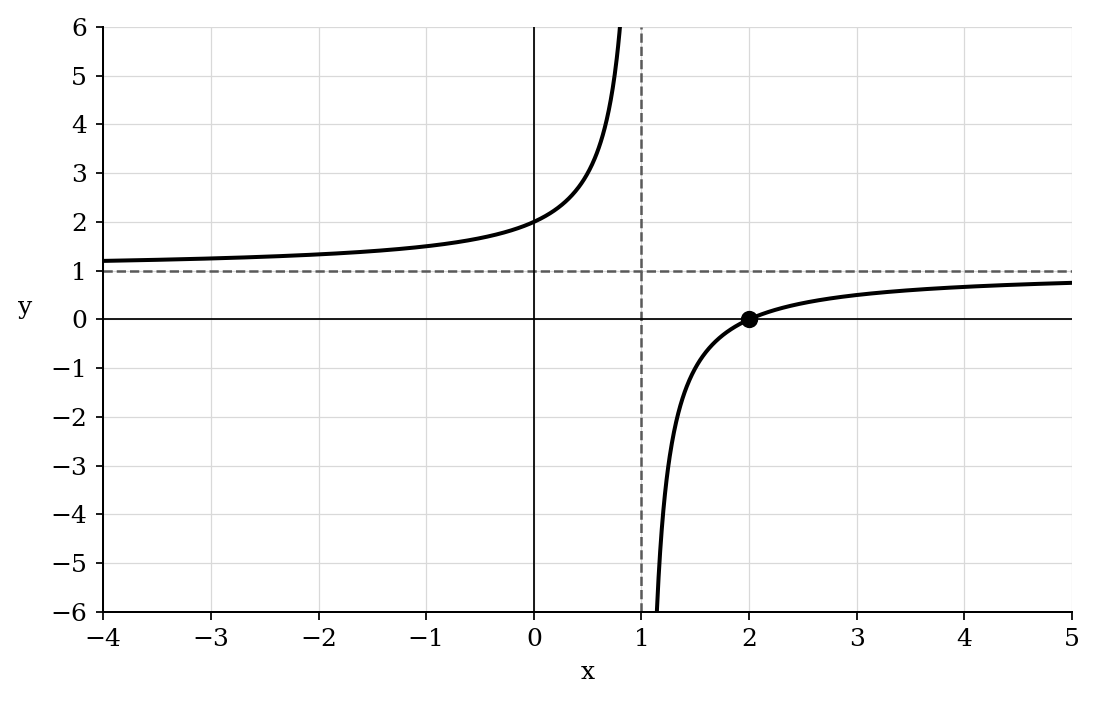
Determine and .
Evaluate .
Determine the vertical asymptote of . Justify your answer using the behaviour of .
Determine the horizontal asymptote of . Justify your answer using limits at infinity.
Represent the intervals on which is continuous.
Determine the value that could be assigned to to make continuous at .
Question 9
Graphing calculator not permitted
The graph of on consists of line segments. The function is continuous except at , where the open circle shows the limiting value and the filled point shows .
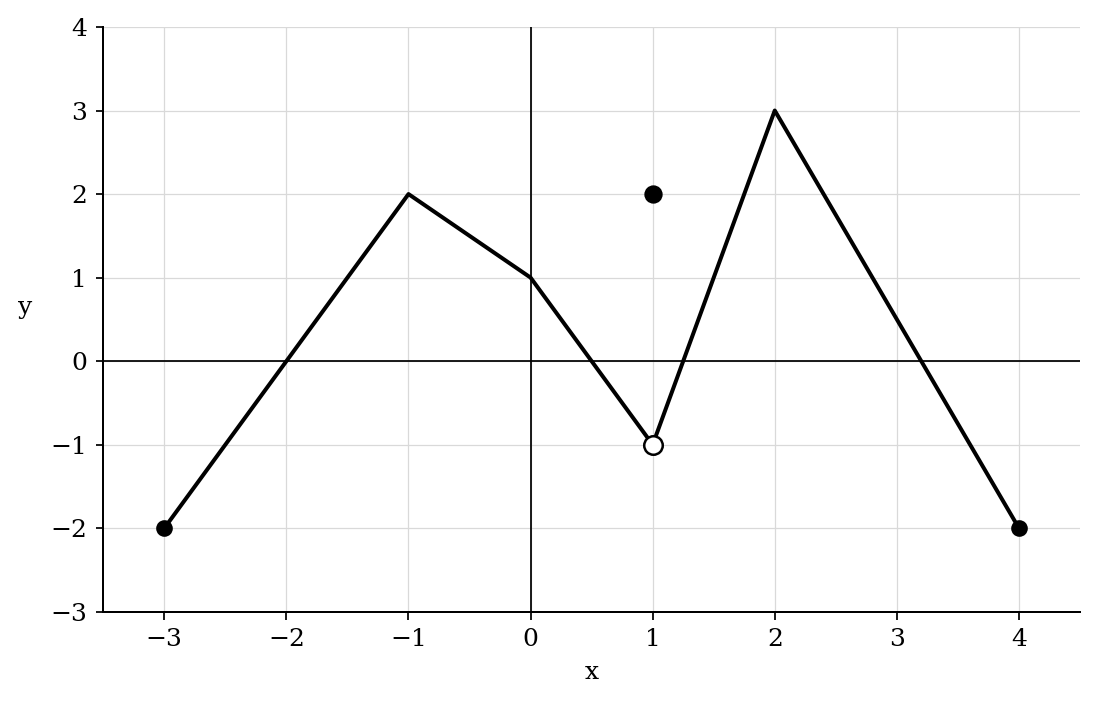
Verify the hypotheses of the Intermediate Value Theorem on and justify that there is at least one for which .
Determine whether the Intermediate Value Theorem can be used on to guarantee a solution to . Explain your answer.
Justify that there is at least one for which .
Explain why the Intermediate Value Theorem alone does not prove that the solution in part (c) is unique.
Question 10
Graphing calculator not permitted
The graph of is shown. Define
For which value of is continuous at ?
A.
B.
C.
D.