

Question 1
Graphing calculator required
During a two-hour filling test, the water depth in a tank is modelled by
for , where is measured in hours and is measured in metres. The graph of and the line tangent to the graph at are shown. Calculator answers should be rounded to three decimal places.
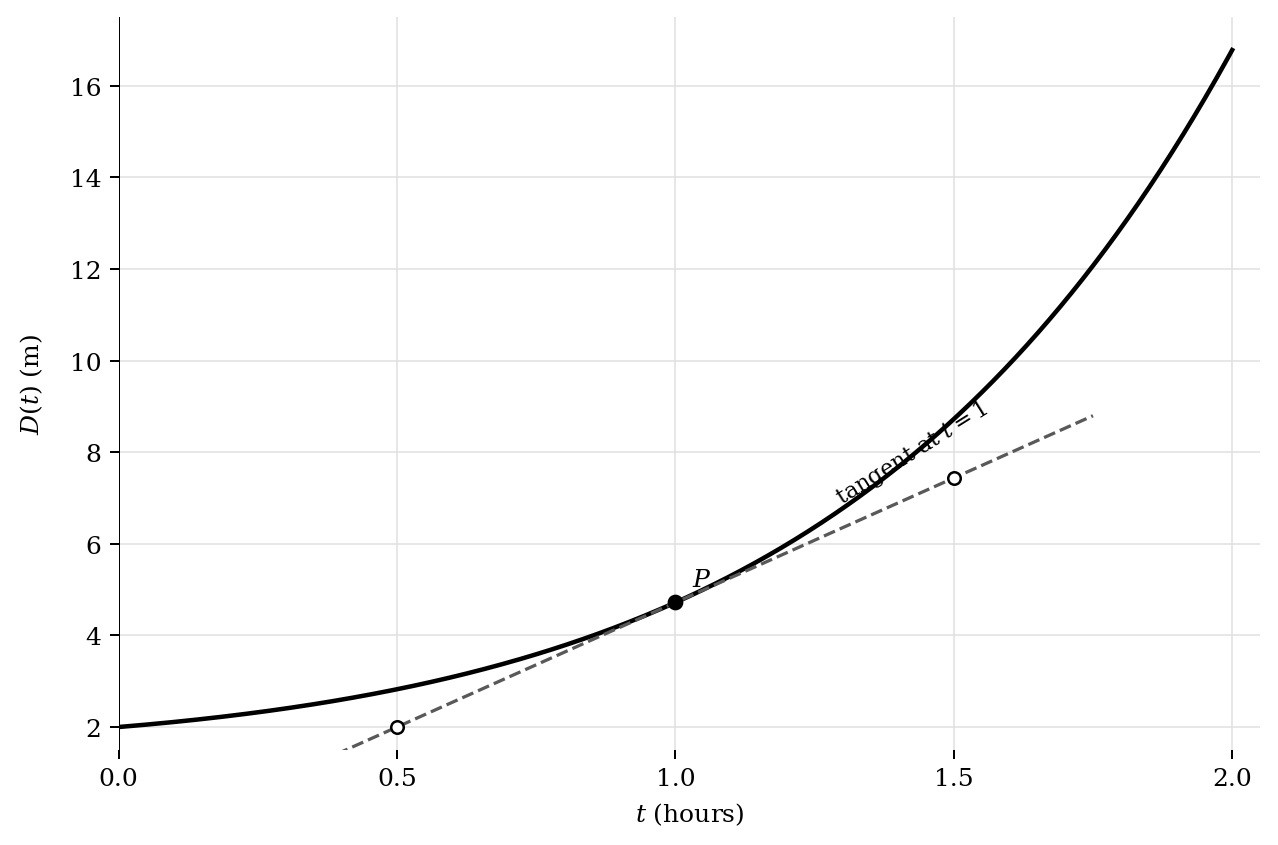
Calculate the average rate of change of the water depth from to . Include units.
Estimate by using two readable points on the tangent line shown in the graph.
Interpret the meaning of your estimate from part (b)(i) in the context of the tank.
Calculate an exact expression for .
Represent the line tangent to the graph of at by an equation.
Write an expression that can be solved to determine when the water depth is increasing at .
Determine the time at which this occurs.
Interpret your answer from part (d)(ii).
Question 2
Graphing calculator required
The concentration of a substance in a mixing tank is modelled by
for , where is measured in hours and is measured in . The graph of and its tangent line at are shown. Calculator answers should be rounded to three decimal places.
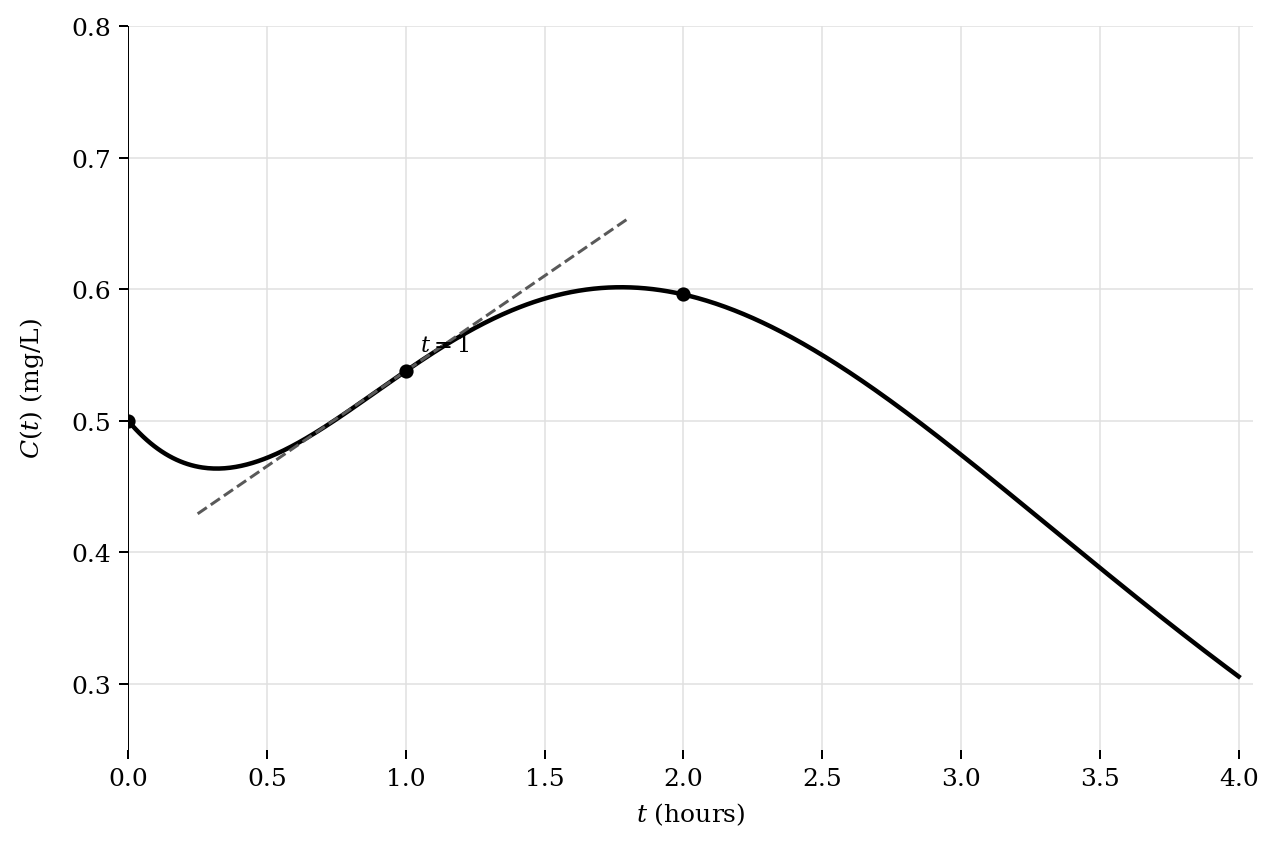
Represent the average rate of change of from to by an expression.
Calculate this average rate of change and include units.
Calculate an expression for .
Evaluate .
Interpret the meaning of in context.
Represent the tangent line to the graph of at by an equation.
Determine all values of in at which the graph has a horizontal tangent. Show the equation solved.
Explain how the graph supports the two numerical answers from part (d)(i).
Question 3
GRAPHING CALCULATOR NOT PERMITTED
Let . What is the average rate of change of on the interval ?
A.
B.
C.
D.
Question 4
Graphing calculator not permitted
The function is defined on by
Its graph is shown.
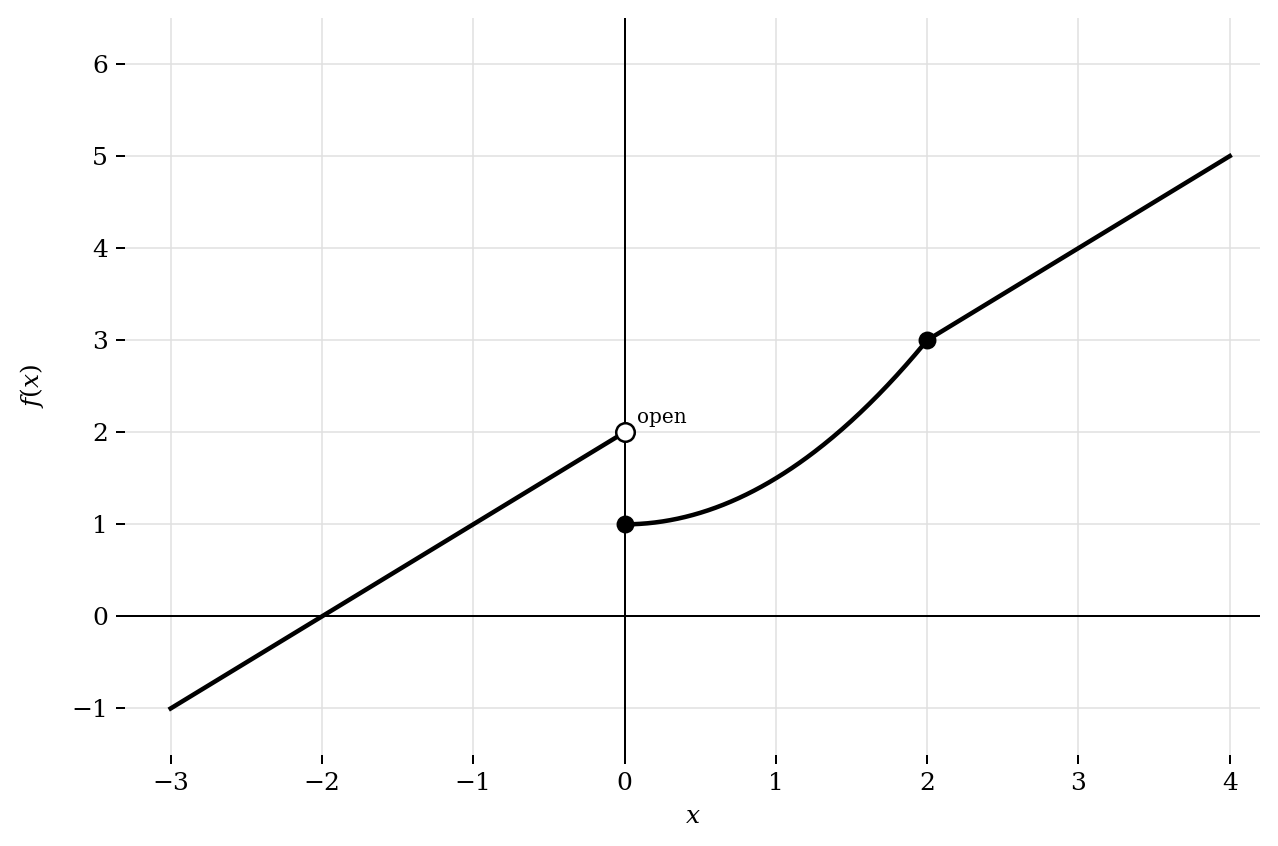
Determine whether is continuous at . Justify your conclusion using limits and the function value.
Determine whether is differentiable at . Justify your conclusion using continuity and one-sided derivatives.
Calculate .
Represent the line tangent to the graph of at by an equation.
Explain why must be continuous at .
Question 5
Graphing calculator not permitted
Let . The point lies on the graph. For each nonzero value of , the point
also lies on the graph. Several secant lines through and , together with the tangent line at , are shown.
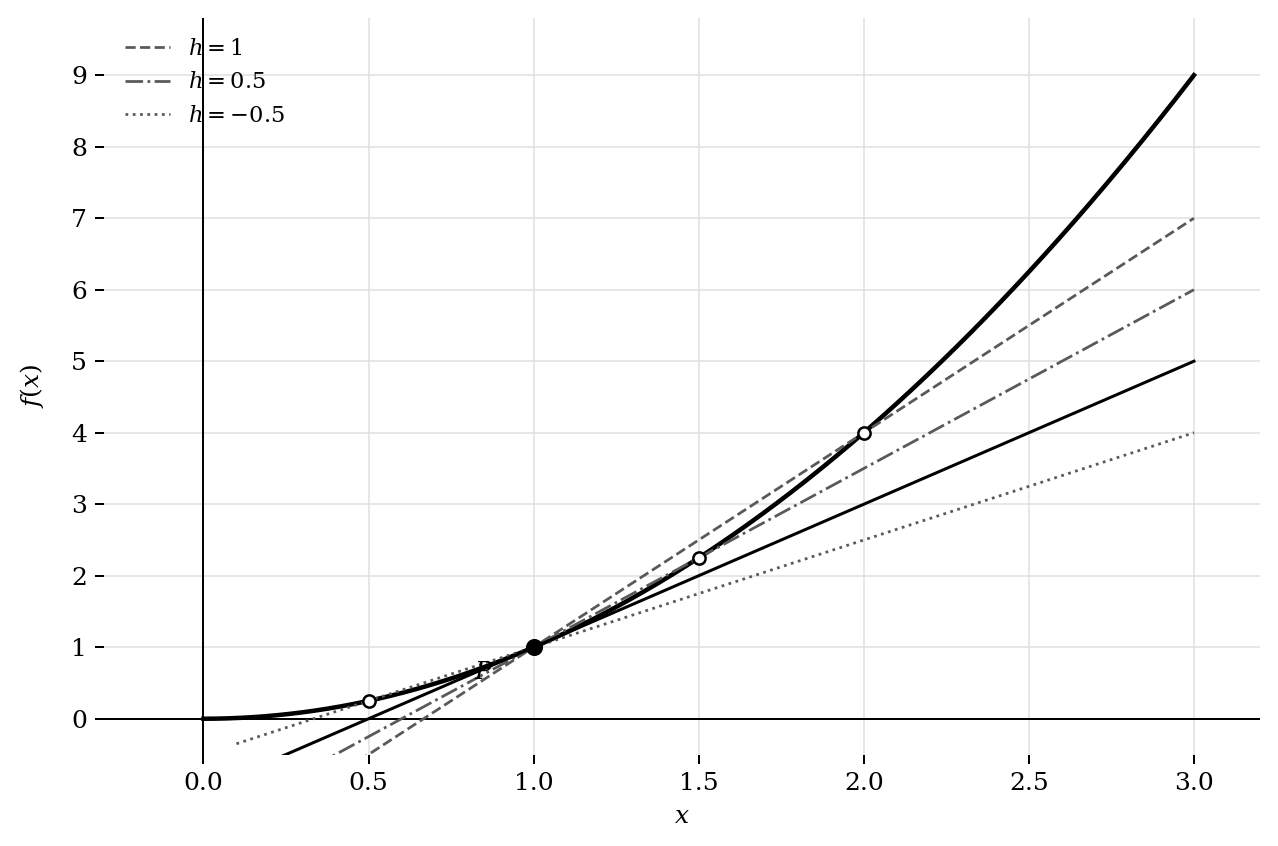
Calculate the slope of the secant line through and for each of the following values: , , and .
Evaluate by using the limit definition of the derivative.
Represent the tangent line to the graph of at by an equation.
Explain how the secant lines shown support the result from part (b). Your explanation must distinguish a secant slope from the tangent slope.
Question 6
Graphing calculator not permitted
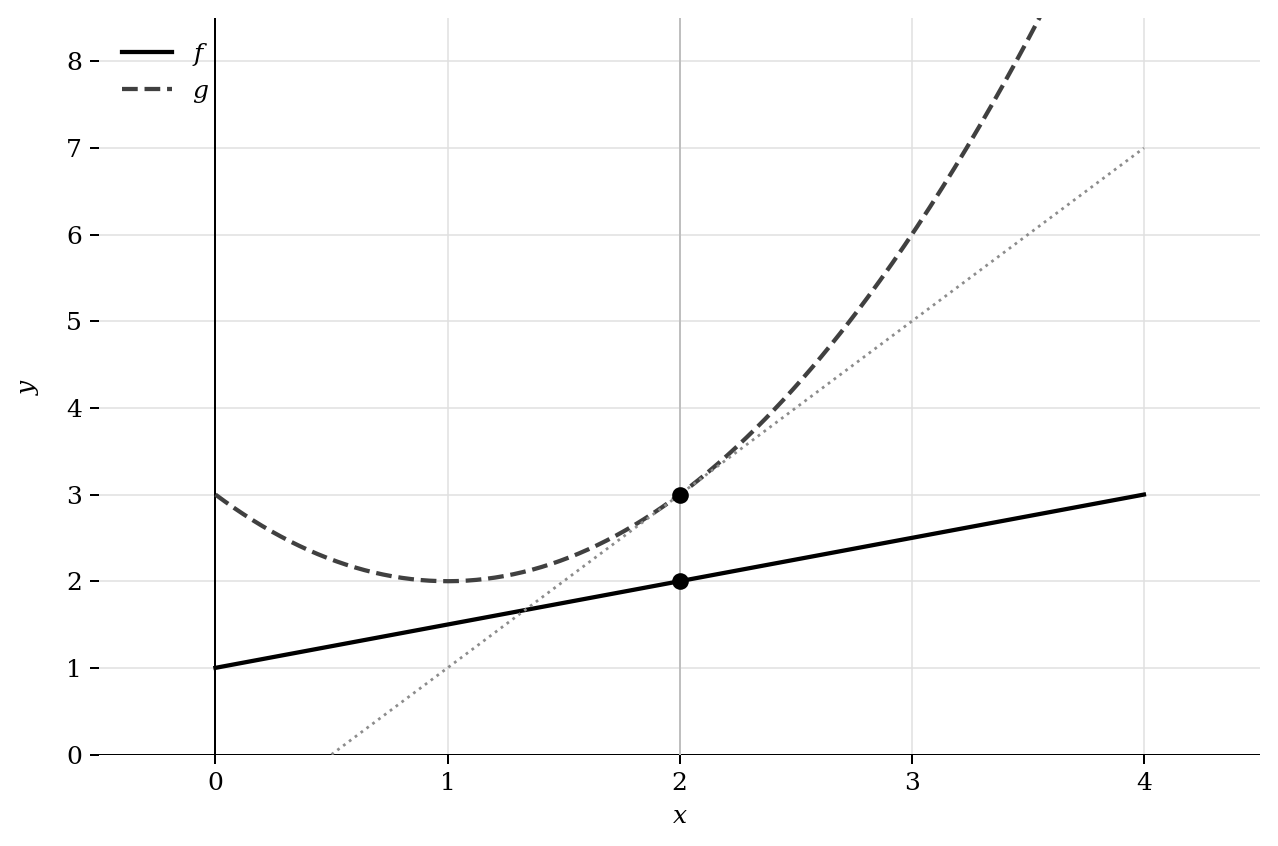
The graph shows differentiable functions and . The solid curve represents , and the dashed line represents . The dotted line is tangent to the graph of at . All necessary function values and slopes can be determined from the coordinate grid.
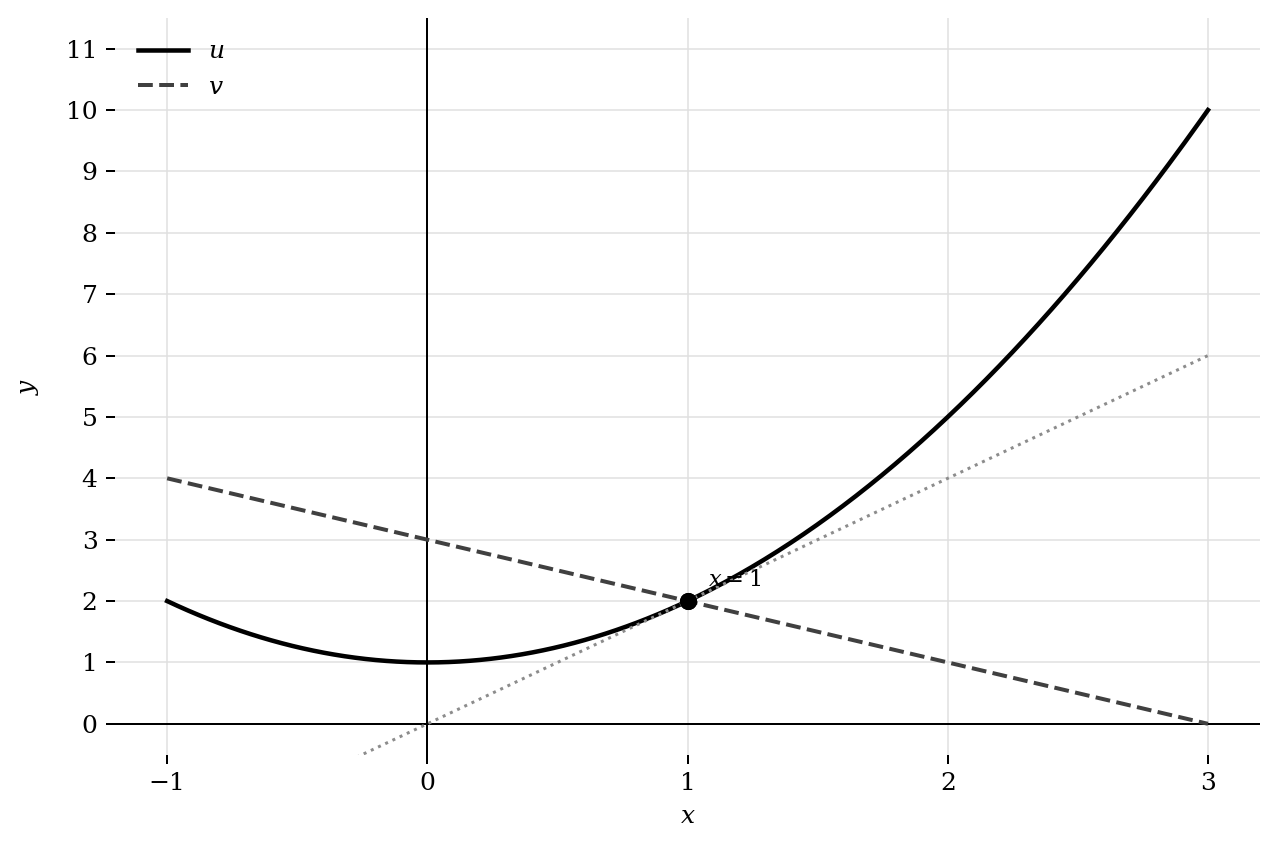
Determine each of the following values from the graph:
, , , and .
Let .
Calculate .
Let .
Calculate .
Represent the line tangent to the graph of at by an equation.
Question 7
Graphing calculator not permitted
The continuous function is piecewise linear on . Its graph consists of line segments joining the labelled points shown.
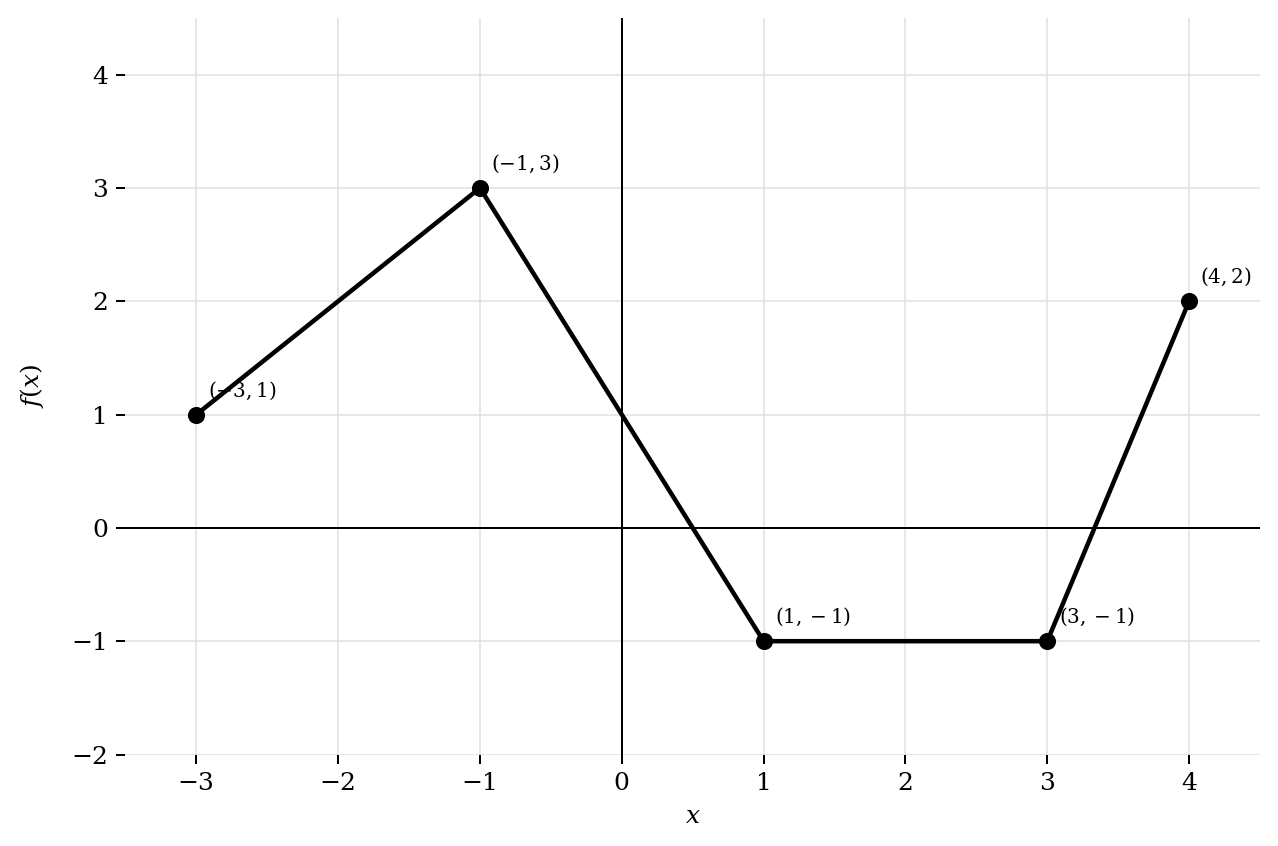
Calculate the average rate of change of on each interval:
Represent on by giving a piecewise definition or an accurately labelled graph. Indicate all points where is undefined.
Determine the interior values of at which does not exist. Explain your reasoning.
Interpret the statement for in terms of the behaviour of .
Question 8
Graphing calculator not permitted
Let . The graph of and two secant lines through the origin are shown. One secant uses , and the other uses .
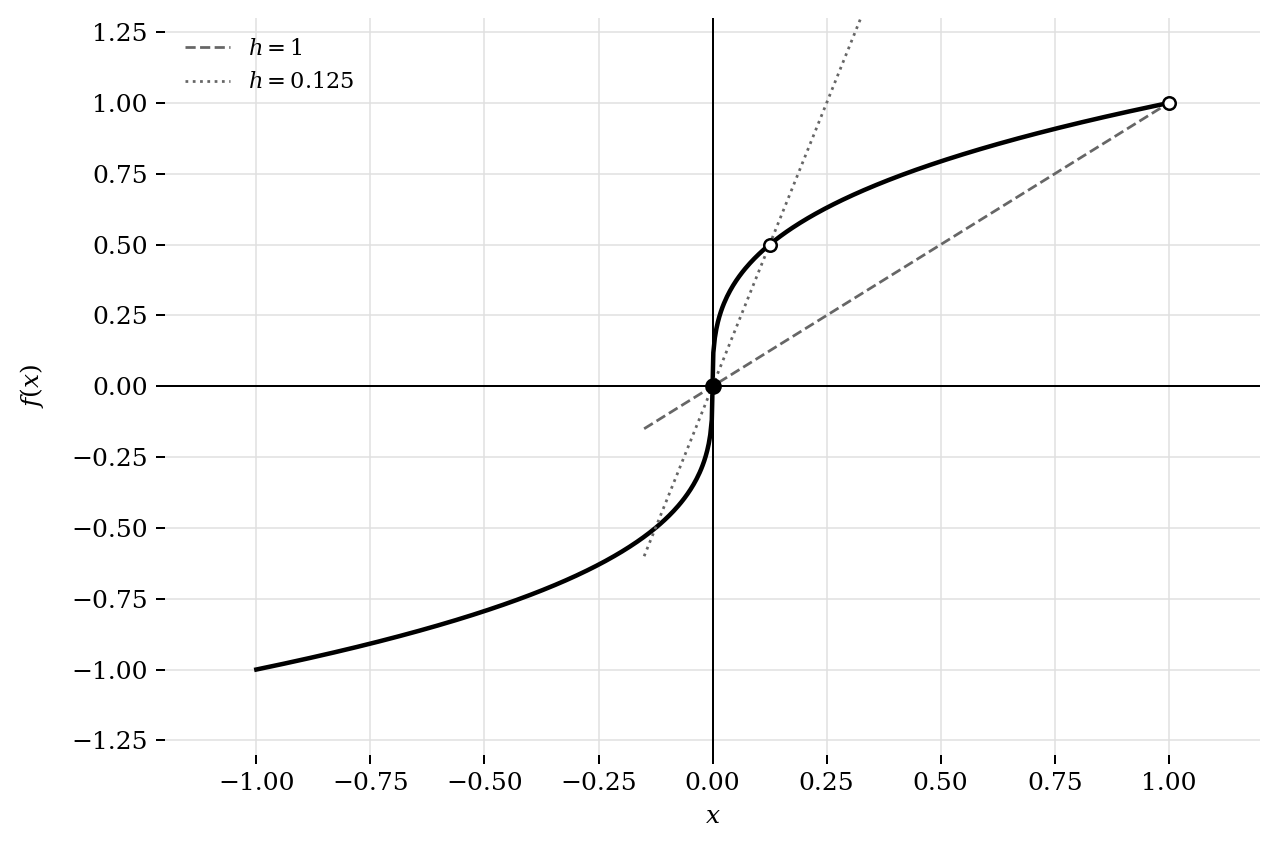
Verify that is continuous at .
Determine whether exists as a finite real number. Use the limit definition of the derivative to justify your conclusion.
Explain why this function demonstrates that continuity at a point does not guarantee differentiability at that point.
Represent each of the two secant lines shown by an equation.
Question 9
Graphing calculator not permitted
The graph of is shown. Which statement is true?
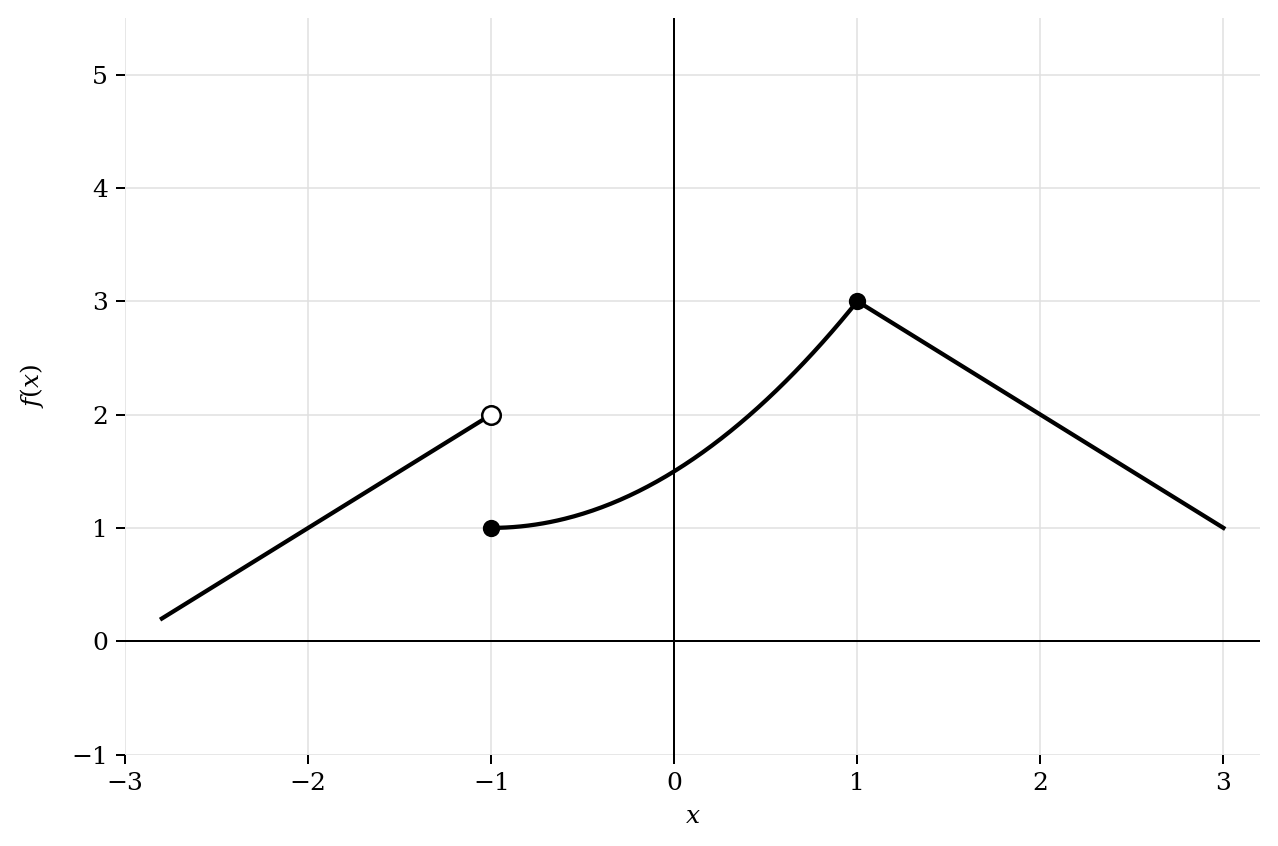
A. is differentiable at because both visible pieces have finite slopes.
B. is continuous but not differentiable at .
C. is differentiable at because it is continuous there.
D. is continuous at because exists.
Question 10
Graphing calculator not permitted
The solid line represents the differentiable function , and the dashed curve represents the differentiable function . The dotted line is tangent to at . Let . What is ?
A.
B.
C.
D.