

Question 1
Graphing calculator required
During cleanup cycle , a filtration system removes grams of a contaminant, where
for . The graph shows the continuous model and the values at integer inputs. Let
.
Round numerical answers to three decimal places.
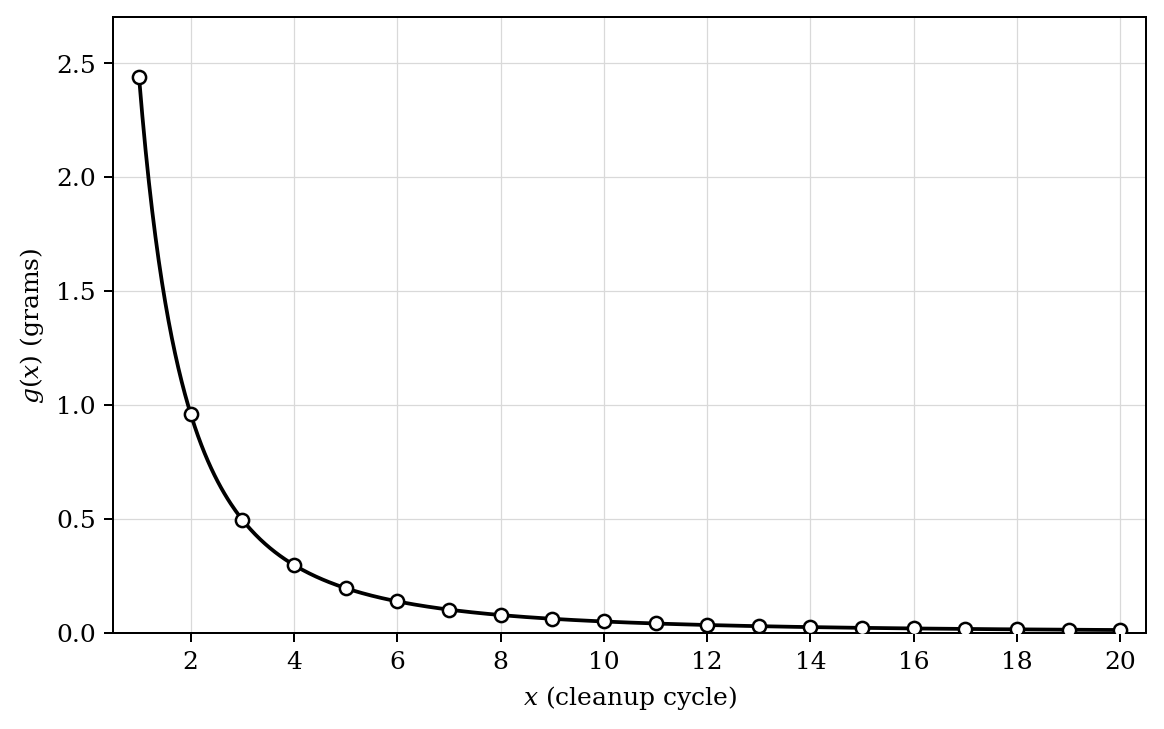
Write an expression for the total amount removed during the first cycles.
Calculate this total.
Verify that satisfies the conditions required for the integral test on .
Determine whether converges.
Write an expression that gives lower and upper bounds for the remainder .
Calculate an interval containing the total amount of contaminant that will eventually be removed.
Write an expression that can be used to guarantee that gram.
Determine the least integer satisfying this guarantee.
Question 2
Graphing calculator not permitted
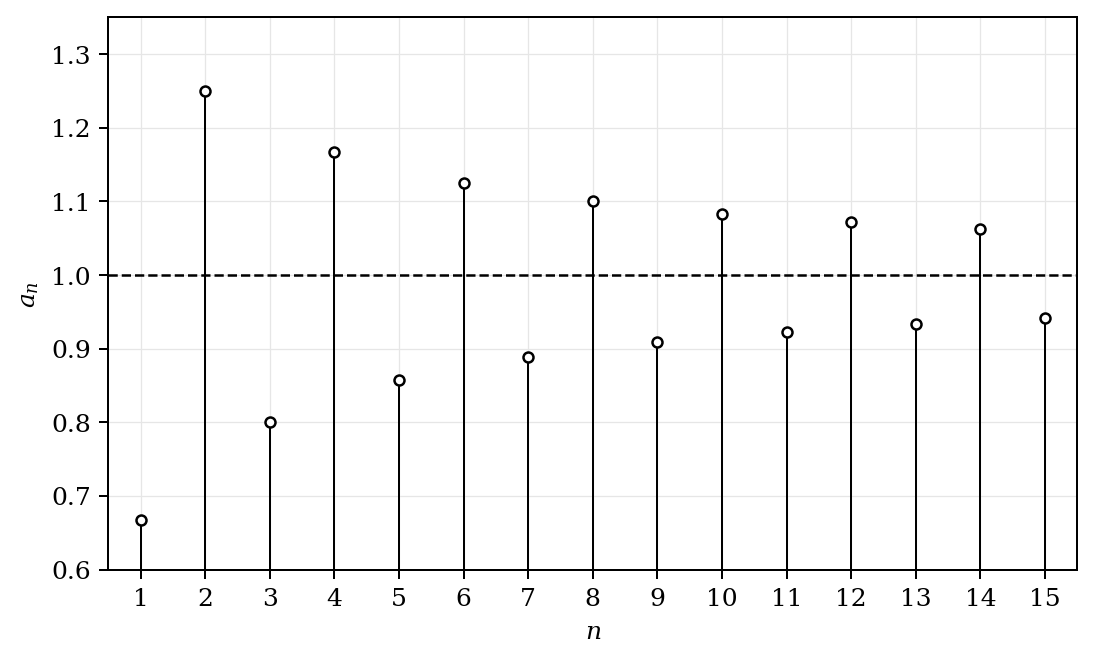
The graph shows the terms of an infinite series .
Which conclusion is justified by the graph?
A. The series converges because the terms are bounded.
B. The series converges because the terms oscillate.
C. The series diverges because .
D. The series diverges because every partial sum is negative.
Question 3
Graphing calculator required
Let . The graph shows , its second-degree Maclaurin polynomial , and its fourth-degree Maclaurin polynomial on . The three curves are labelled A, B, and C.
Round numerical answers to three decimal places.
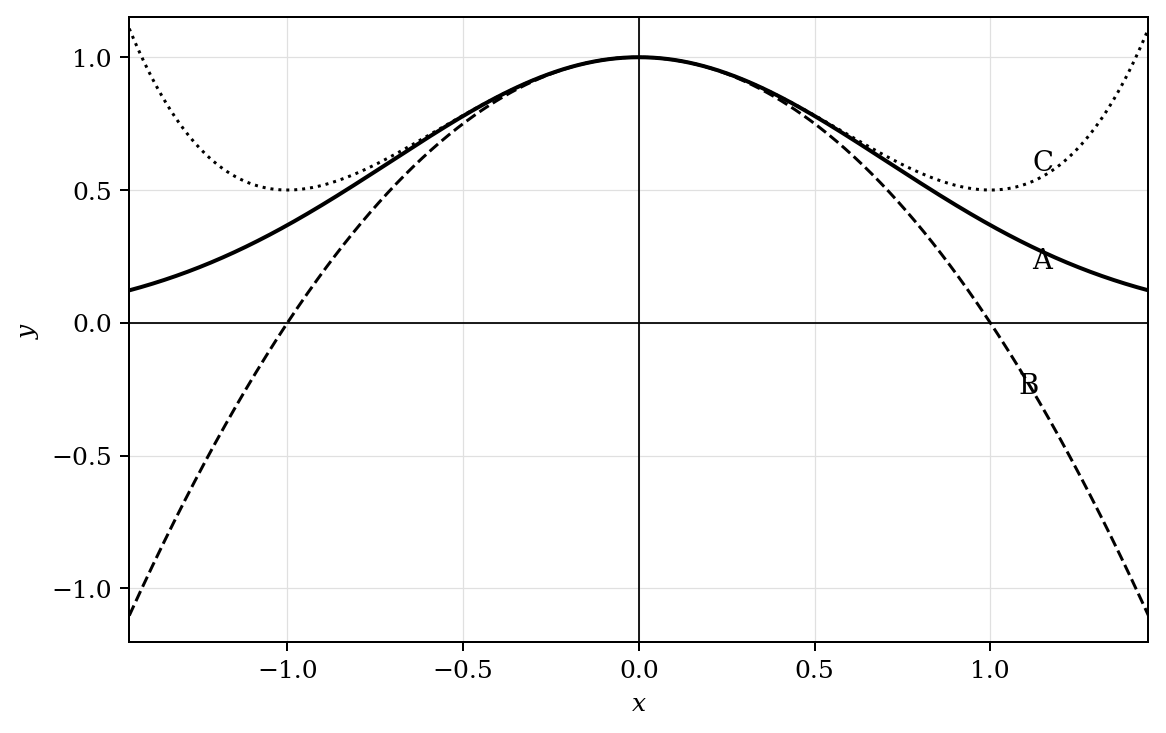
Identify the curve representing .
Identify the curve representing .
Represent by using the Maclaurin series for with an appropriate substitution.
Calculate and .
Calculate the absolute error when is used to approximate .
Write an expression whose positive solution gives the largest value such that the error is at .
Determine this value of .
Explain how the graph indicates whether is an overestimate or an underestimate of for .
Question 4
GRAPHING CALCULATOR NOT PERMITTED
For an infinite series, denotes the sum of its first terms. Suppose for every positive integer . What is the sum of the infinite series?
A.
B.
C.
D. The series diverges.
Question 5
Graphing calculator not permitted
A positive sequence satisfies . Define
.
The graph shows the values of . The dashed horizontal line shows the limiting level approached by the ratios.
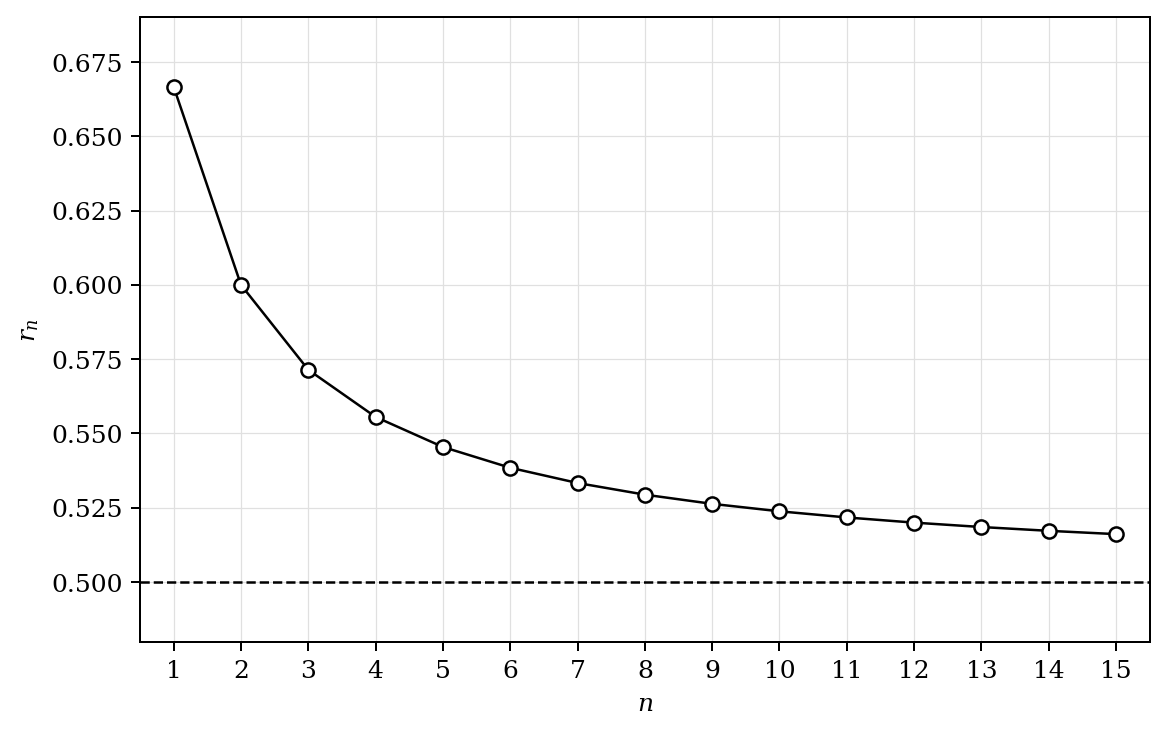
Calculate using the value of shown in the graph.
Calculate using the value of shown in the graph.
Calculate using the value of shown in the graph.
Determine from the graph.
Justify whether converges.
A second sequence is defined by .
Determine .
Justify whether converges.
Explain why observing for only the displayed values of would not, by itself, prove that converges.
Question 6
Graphing calculator not permitted
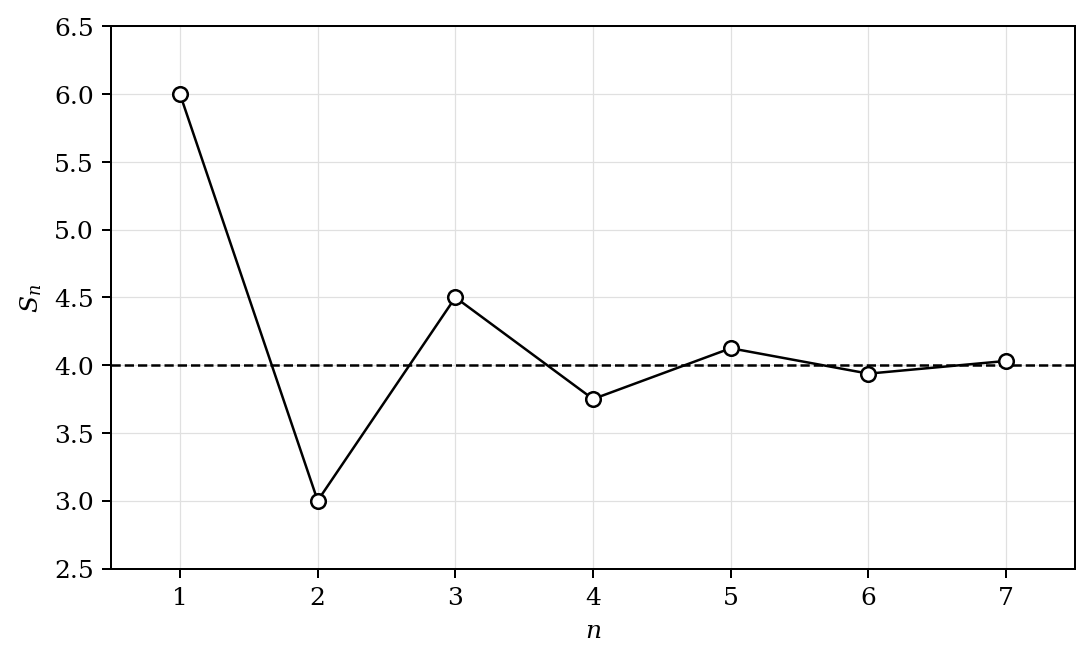
A measuring instrument is calibrated through a sequence of signed corrections. The th correction is millimetres, and
is the net displacement after corrections. Each correction has half the magnitude and the opposite sign of the preceding correction. The graph shows the partial sums .
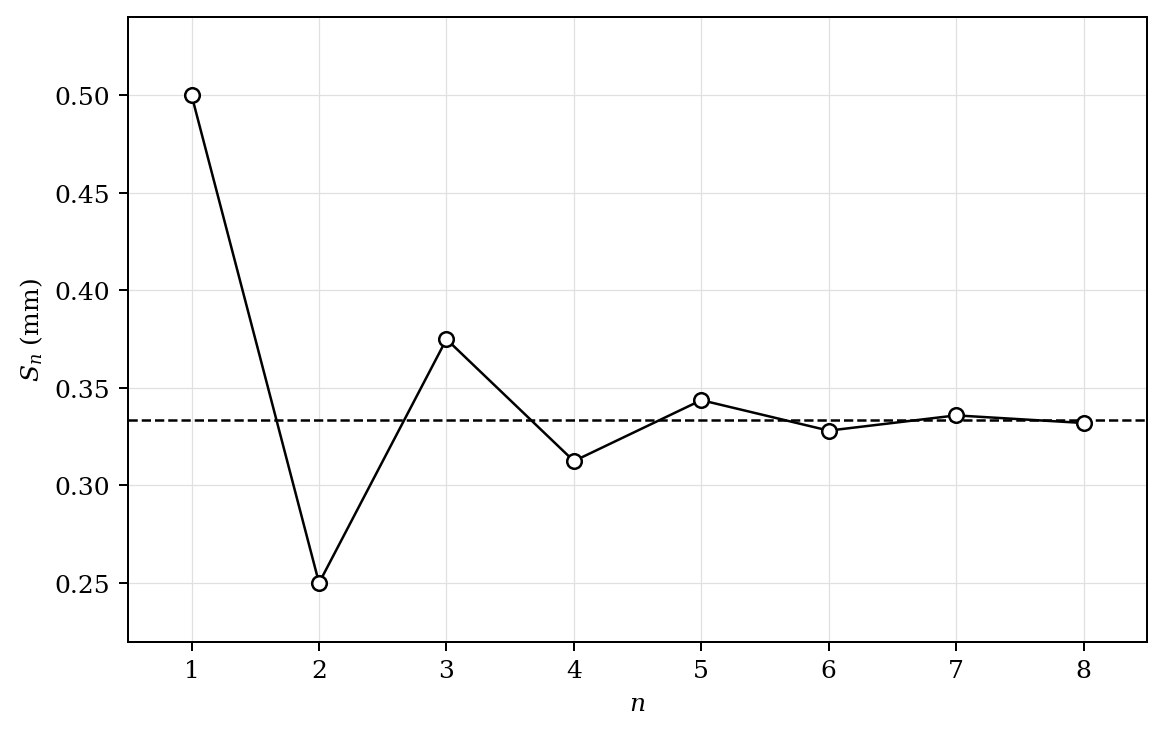
Calculate using the partial sums in the graph.
Calculate using the partial sums in the graph.
Represent the instrument’s eventual net displacement as an infinite geometric series.
Determine the exact sum of this series.
Explain why the odd partial sums overestimate the eventual displacement while the even partial sums underestimate it.
Calculate the actual error when is used to approximate the infinite sum.
Verify that this error satisfies the alternating-series error bound.
Interpret the infinite sum in the context of the instrument.
Question 7
Graphing calculator not permitted
A patient receives a dose of milligrams of a medication at equal time intervals. Immediately before each new dose, a constant fraction of the medication present after the preceding dose remains in the body.
Let be the amount present immediately after the th dose. The graph shows for the first several doses.
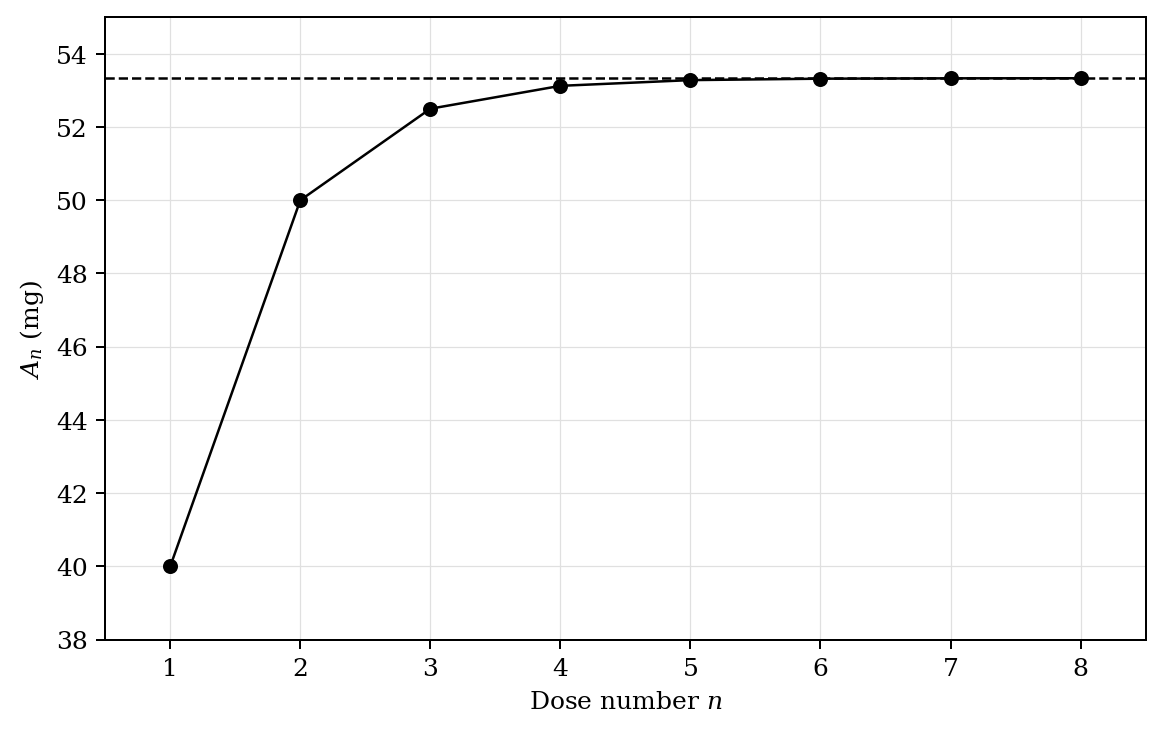
Calculate the amount remaining from the first dose immediately before the second dose.
Determine the fraction of the medication that remains between consecutive doses.
Write an expression for as a finite geometric sum.
Represent as a closed-form expression.
Determine .
Explain how the graph supports this limiting value.
Write an expression that determines when is within milligram of its limiting value.
Determine the least dose number for which this occurs.
Interpret the limiting value in context.
Question 8
Graphing calculator not permitted
Consider the power series
.
For the coefficients , define
.
The graph shows the sequence and its limiting level.
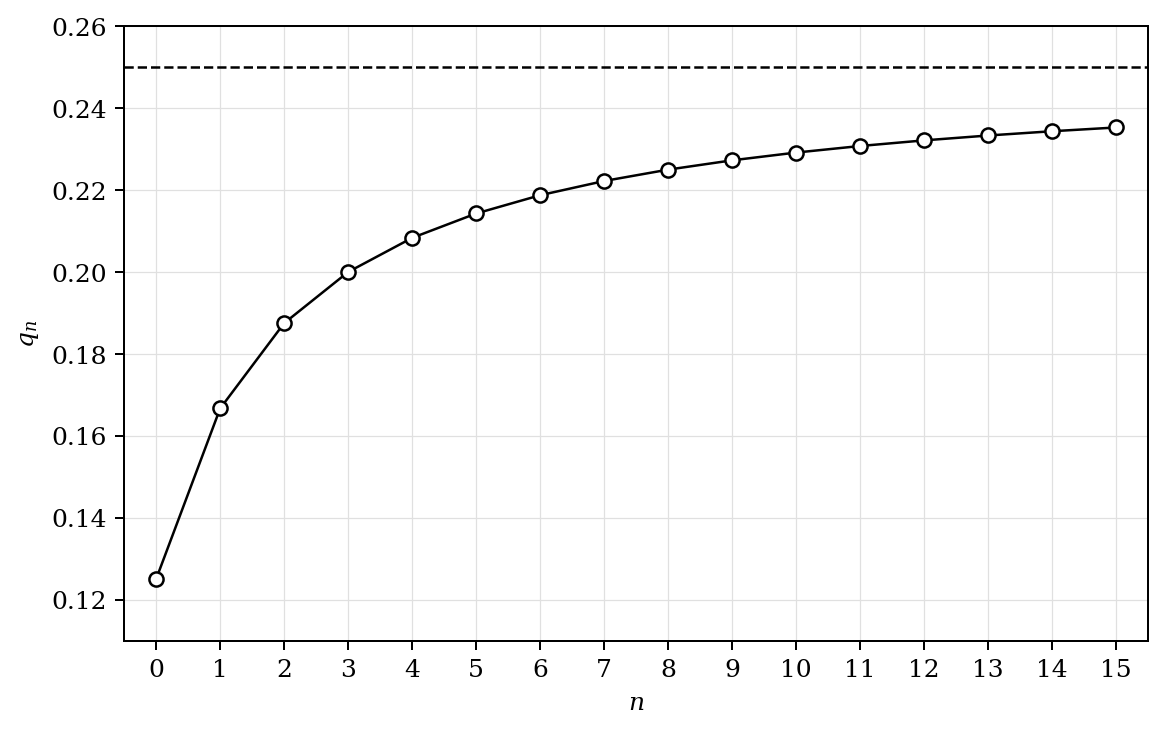
Determine from the graph.
Calculate the radius of convergence of .
Verify whether the series converges at .
Verify whether the series converges at .
Represent the interval of convergence on a number line, including correct endpoint notation.
Write the interval of convergence using interval notation.
Explain what can be concluded about the radius of convergence after the series is differentiated term by term.
Question 9
Graphing calculator not permitted
The graph shows the terms of the series
,
where
.
The dashed curves show the positive and negative magnitude envelopes.
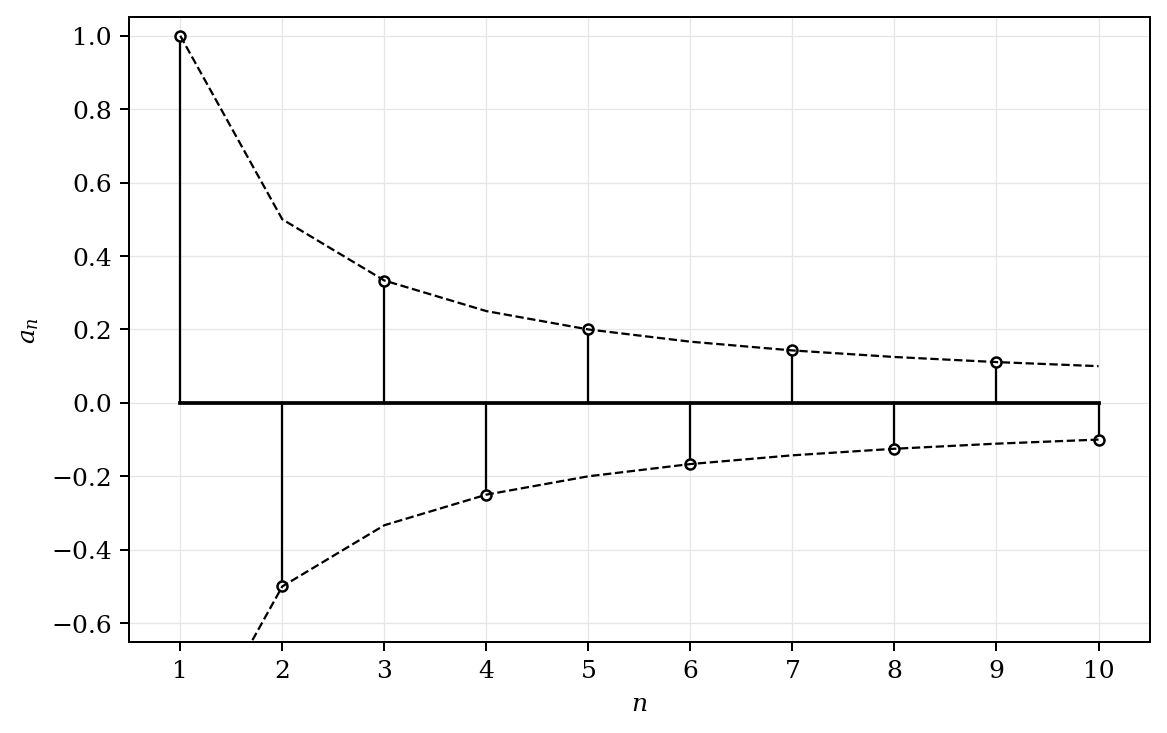
Verify that the magnitudes are positive and decreasing.
Verify the limiting condition required by the alternating series test.
Determine whether converges.
Represent the absolute-value series as a familiar series.
Determine whether the absolute-value series converges.
Justify the classification of the original series as absolutely convergent, conditionally convergent, or divergent.
Calculate the fourth partial sum .
Estimate an interval containing the value of the infinite sum by using the alternating-series error bound.
Determine whether is an overestimate or an underestimate of the infinite sum, and justify the conclusion.
Question 10
Graphing calculator not permitted
The graph shows the partial sums
of a geometric series. What is the value of the fourth term, ?
A.
B.
C.
D.