
Question 1
A sample of magnesium is analyzed using mass spectrometry. The spectrum below shows three peaks, each corresponding to a singly charged magnesium ion formed from a naturally occurring isotope of magnesium.
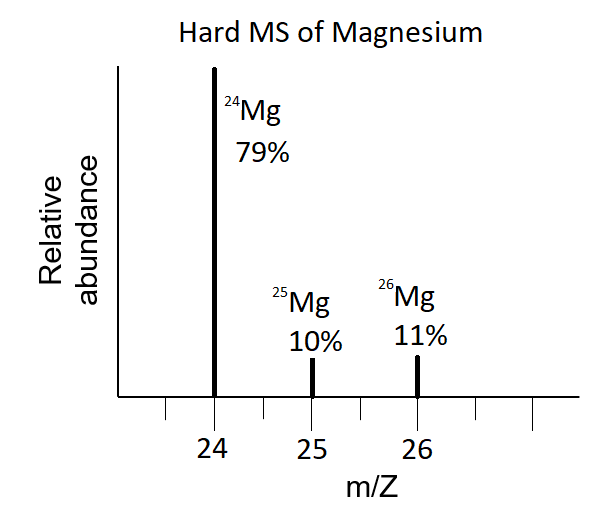
Identify the mass numbers of the magnesium isotopes shown in the spectrum.
Calculate the average atomic mass of magnesium using the relative abundances shown.
Explain why the average atomic mass is closer to 24 amu than to 25 amu or 26 amu.
Question 2
A simplified diagram of a mass spectrometer is shown below. A sample is ionized, and the resulting positive ions are deflected before reaching a detector.
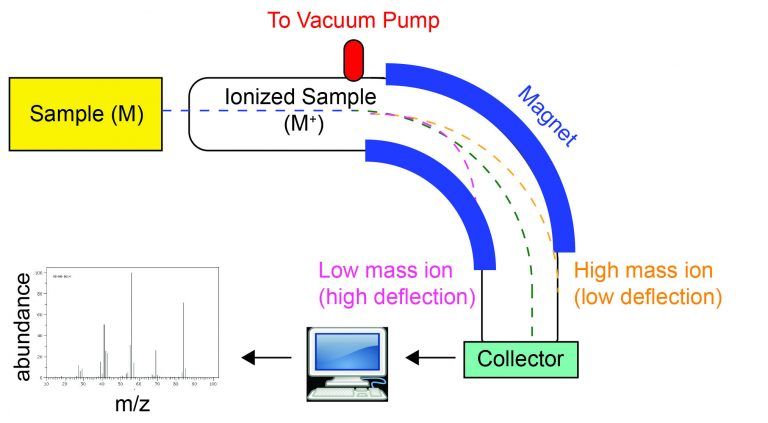
Describe the role of ionization in the mass spectrometer shown.
Determine whether a lighter ion or a heavier ion would be deflected more in the instrument.
Explain how the instrument can be used to determine the relative abundance of isotopes of a single element.
Question 3
A student measures the masses of several pure samples of the same substance. The results are shown in the graph below. The relationship can be used to connect mass, moles, and molar mass.
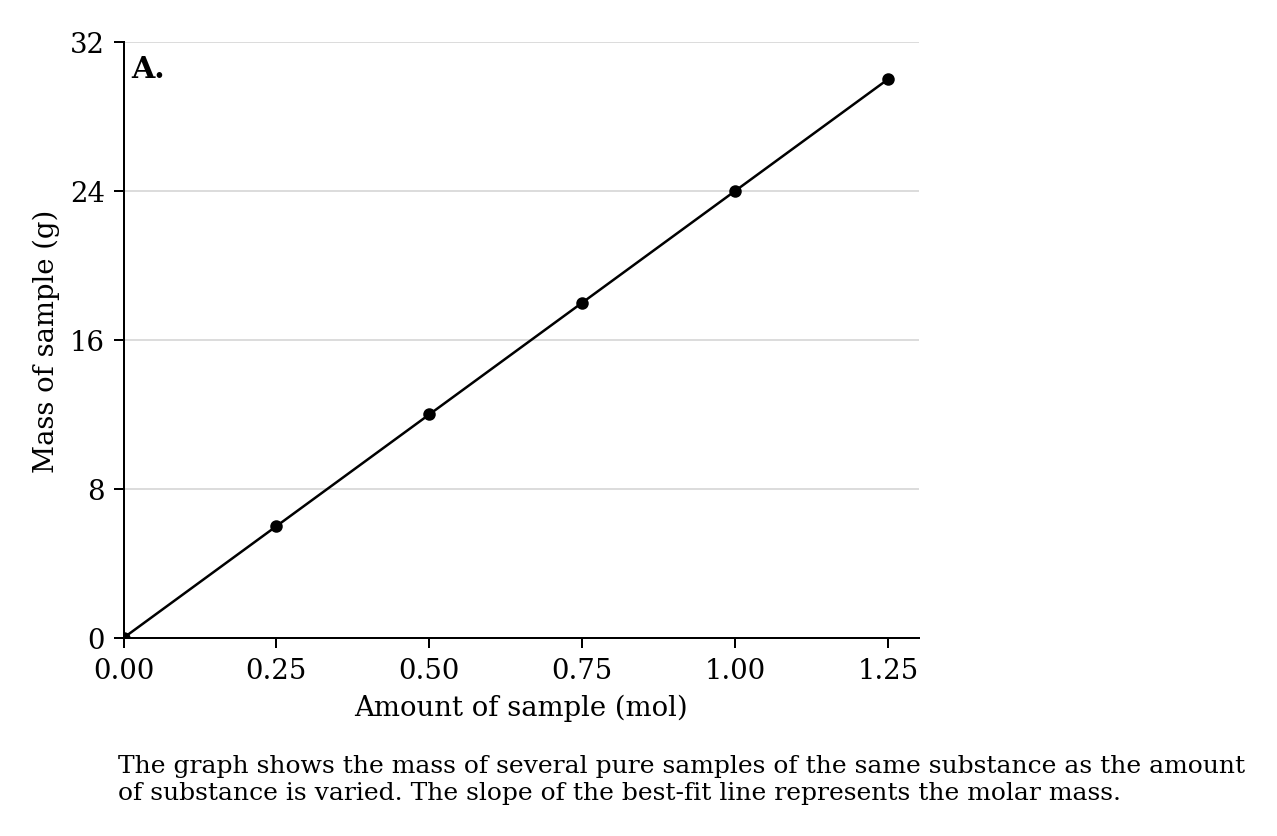
Determine the molar mass of the substance from the graph.
Calculate the mass of a sample of the substance.
Explain why mass can be used to compare the number of particles in different samples of the same pure substance.
Question 4
A sample containing a single element is analyzed using mass spectrometry. The resulting mass spectrum is shown below. Each peak represents a singly charged isotope of the element.
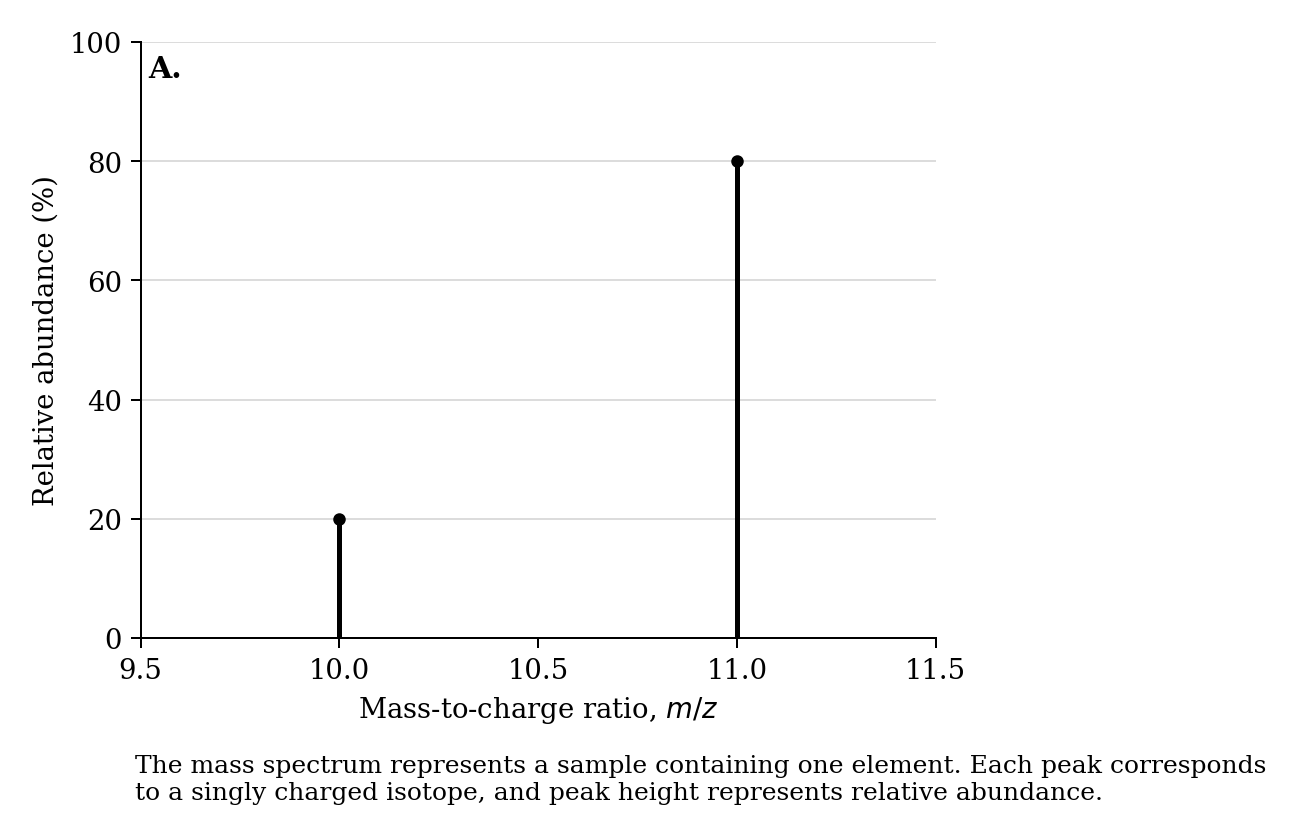
Identify the mass number of the more abundant isotope.
Calculate the estimated average atomic mass of the element.
Explain how the mass spectrum provides evidence that the sample contains isotopes of the same element.
Question 5
A mass spectrum of boron is shown below. The two peaks correspond to the two naturally occurring isotopes of boron.

Identify the isotope with the greater relative abundance.
Calculate the average atomic mass of boron using the relative abundances 23 and 100.
Justify why the average atomic mass is not equal to the simple average of 10 amu and 11 amu.
Question 6
A mass spectrum of zirconium is shown below. The spectrum includes peaks for several naturally occurring isotopes of zirconium, with percentage abundances indicated.

Identify the zirconium isotope with the greatest relative abundance.
Calculate the average atomic mass of zirconium using the abundance data shown on the page.
Explain why the average atomic mass is between 90 amu and 92 amu rather than near 96 amu.
Question 7
The diagram below models the relative size of an atom compared with its nucleus. The atom is represented as a much larger region surrounding a very small nucleus.
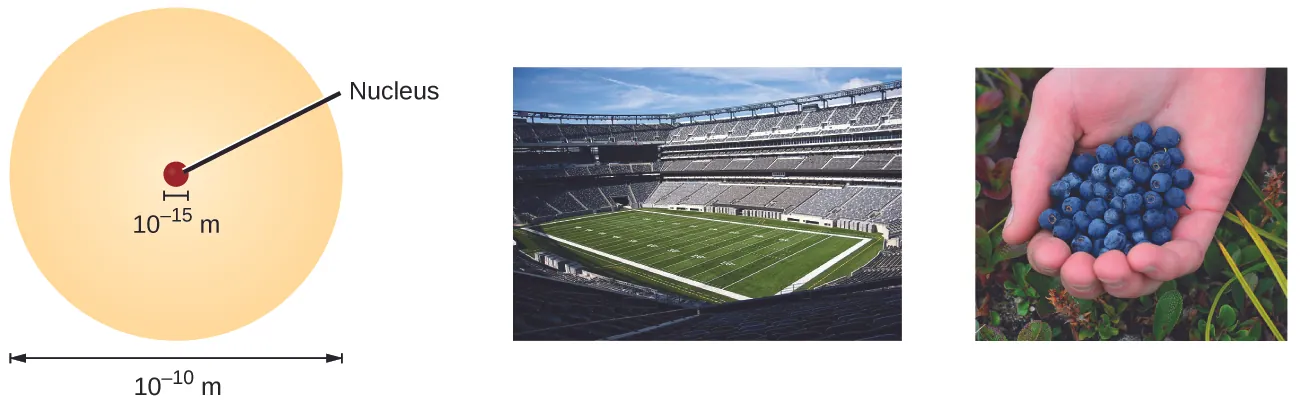
Describe the relative sizes of the atom and nucleus represented in the image.
Identify the subatomic particles found in the nucleus.
Explain why most of the atom’s mass is concentrated in the nucleus.
Justify why electrons farther from the nucleus are generally easier to remove than electrons closer to the nucleus.
Question 8
The image below shows how covalent radius is determined for atoms in diatomic molecules and compares radii for several halogen atoms.
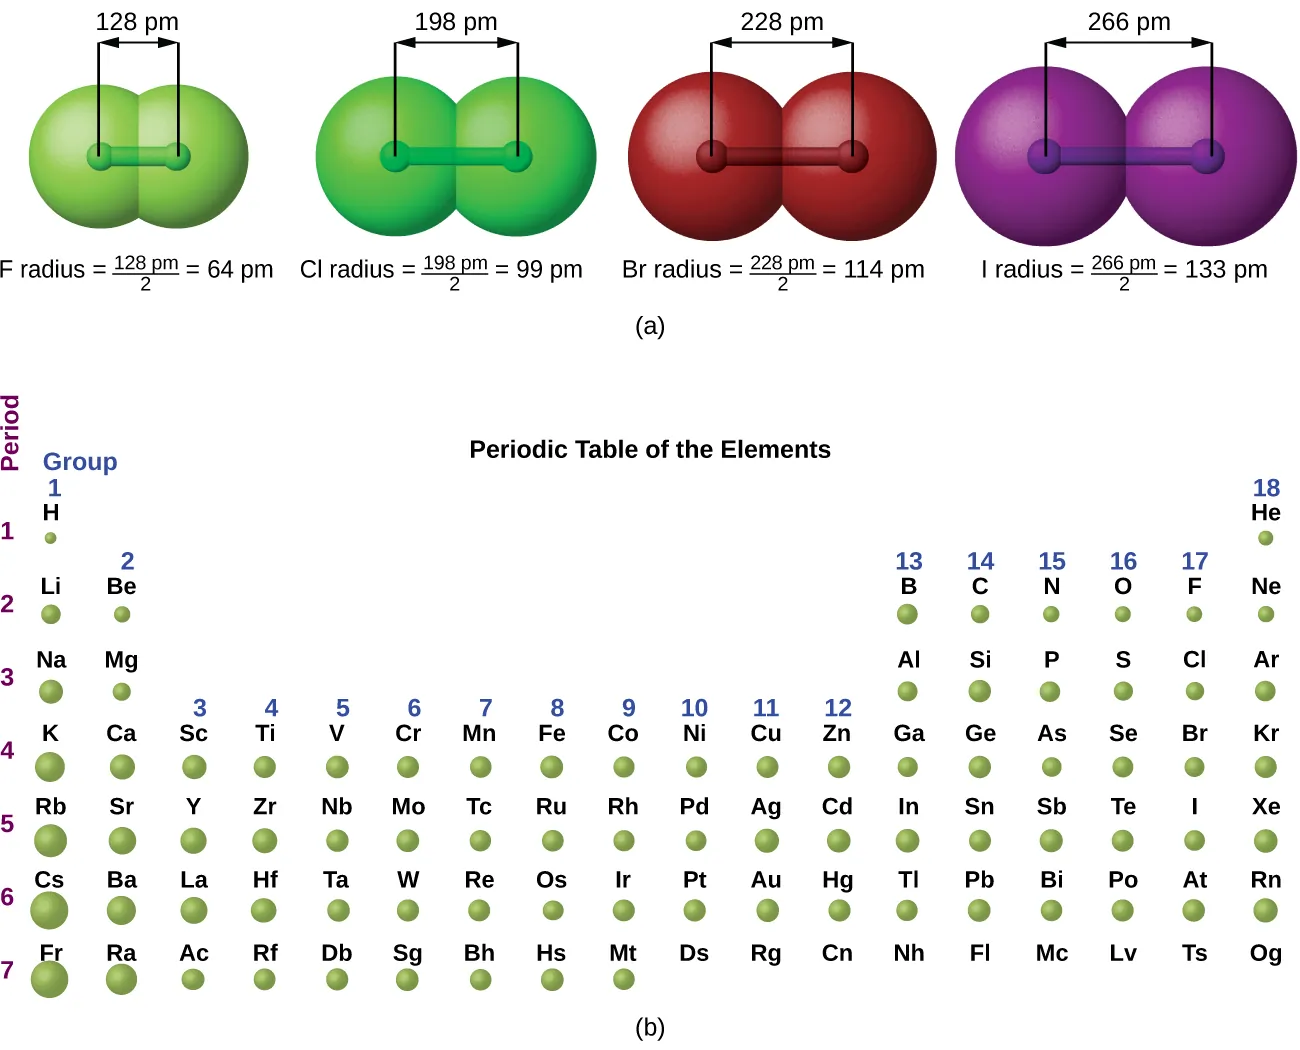
Describe how the covalent radius of a halogen atom is determined from a diatomic molecule.
Identify the general trend in covalent radius as the halogens are considered from fluorine to iodine.
Explain the trend using shells and Coulombic attraction.
Question 9
The graph below shows first ionization energy plotted against atomic number for elements in the first several periods.
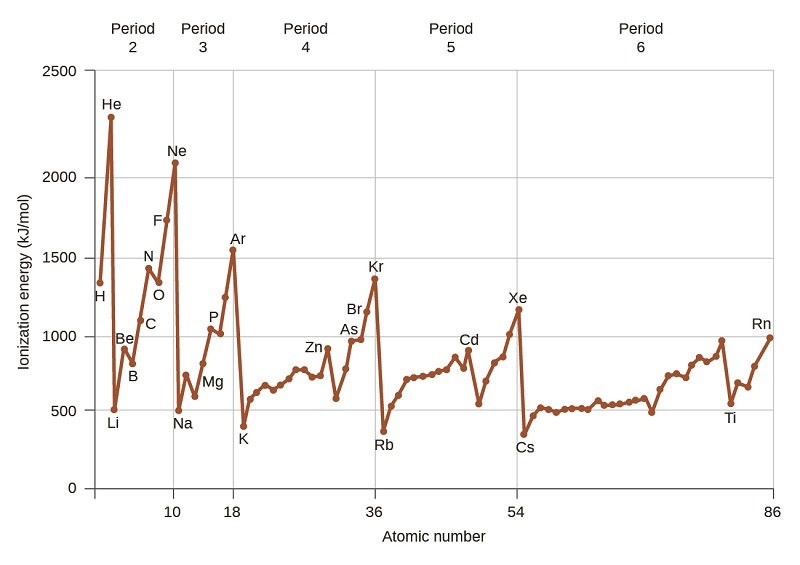
Describe the general trend in first ionization energy across a period.
Describe the general trend in first ionization energy down a group.
Explain the repeated high points shown for noble gases.
Justify why the trend is not perfectly smooth across each period.
Question 10
The periodic table below displays first ionization energy values for selected elements. Arrows on the table indicate broad periodic trends.
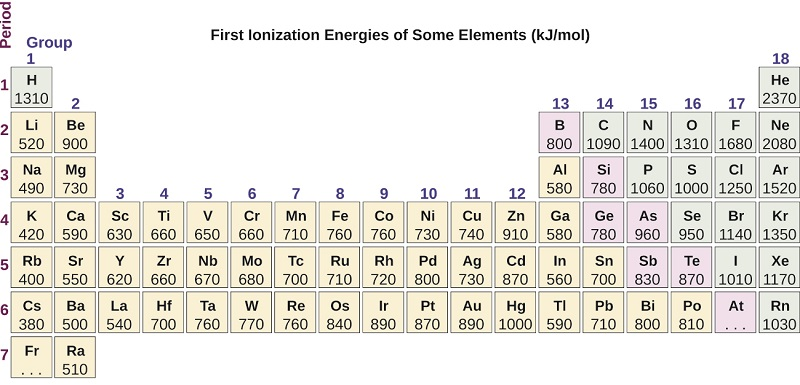
Predict which element has the greater first ionization energy: sodium or magnesium.
Explain the prediction using effective nuclear charge and electron configuration.
Predict whether potassium or sodium has the lower first ionization energy.
Justify the prediction using distance from the nucleus and shielding.