
Question 1
The diagram below shows a three-dimensional arrangement of alternating ions in a crystalline solid. The smaller spheres represent cations and the larger spheres represent anions. This question is based on ionic bonding, Coulombic attraction, and particulate models of ionic solids.
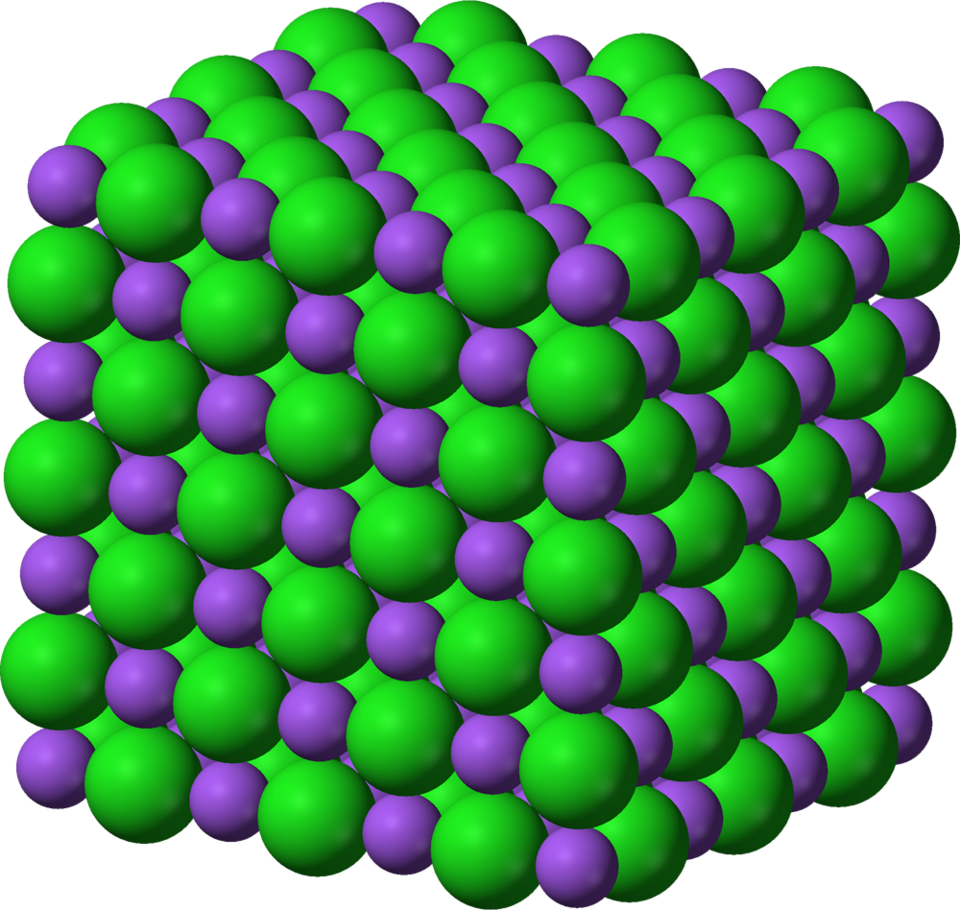
Identify the type of bonding represented by the arrangement in the diagram.
Explain why the ions are arranged in an alternating pattern rather than grouped by charge.
Predict what would happen to the solid if a layer of ions were shifted so that ions of the same charge became adjacent. Justify your answer.
Question 2
The graph below shows the potential energy of two atoms as the distance between their nuclei changes. The lowest point on the curve represents the most stable separation between the atoms.
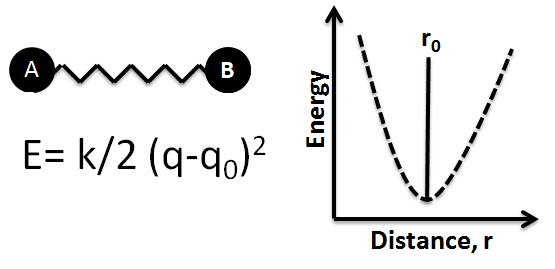
Identify the point on the curve that represents the equilibrium bond length.
Explain why the potential energy increases sharply when the atoms are forced closer together than the equilibrium distance.
Predict how the curve for a stronger covalent bond would differ from the curve shown.
Question 3
A student studies the interaction between two atoms that form a covalent bond. The potential energy of the system is measured as the internuclear distance changes. The results are shown in the graph below.
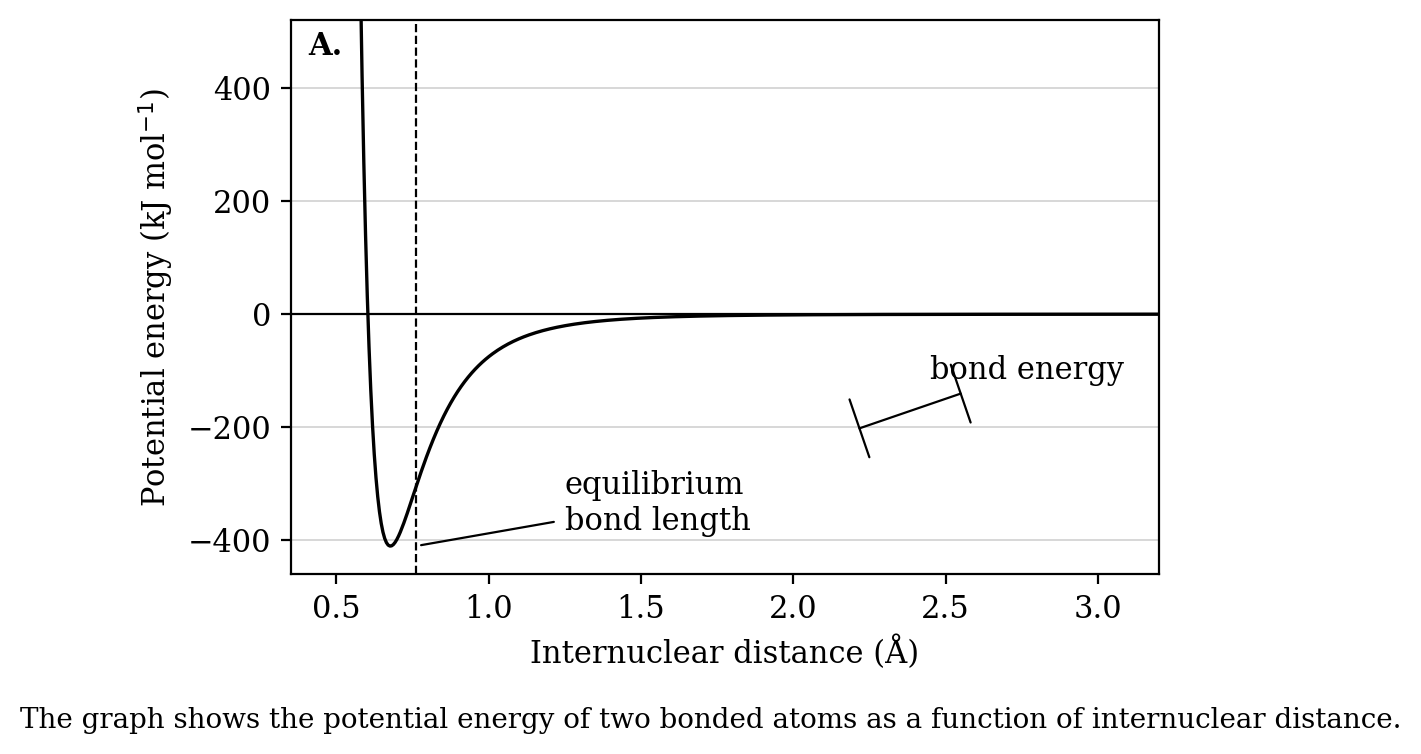
Identify the approximate equilibrium bond length shown in the graph.
Explain why the potential energy increases sharply at very small internuclear distances.
Determine whether energy is absorbed or released as the two atoms move from a large internuclear distance to the equilibrium bond length.
Justify why the depth of the potential energy well is related to bond energy.
Question 4
A student compares three covalent bonds between the same two elements. The bonds differ only in bond order. The graph below shows how bond length and relative bond energy change as bond order increases.
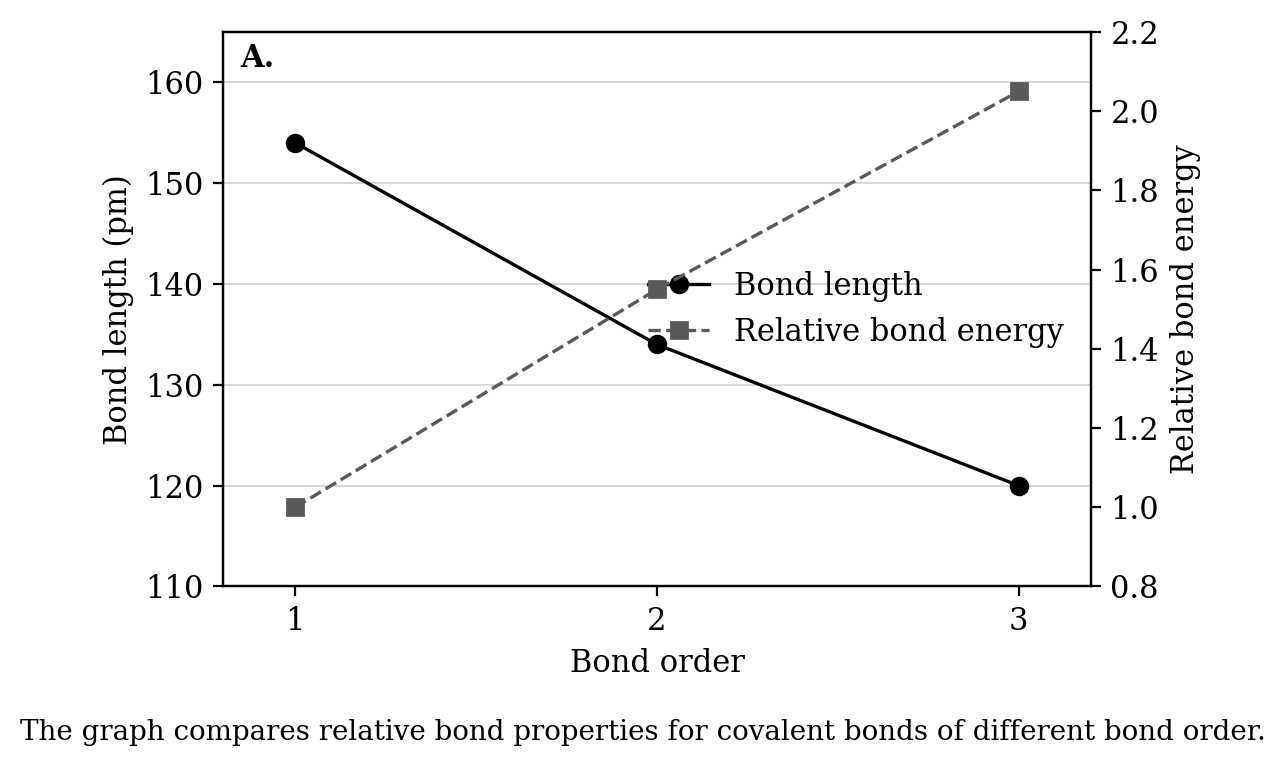
Describe the relationship between bond order and bond length shown in the graph.
Describe the relationship between bond order and relative bond energy shown in the graph.
Explain why a triple bond is shorter than a single bond between the same two atoms.
Predict which bond order would be hardest to break, and justify your prediction using the graph.
Question 5
The diagram below models a metallic solid. The circles represent positive metal ions and the surrounding symbols represent valence electrons that are not fixed to one atom.
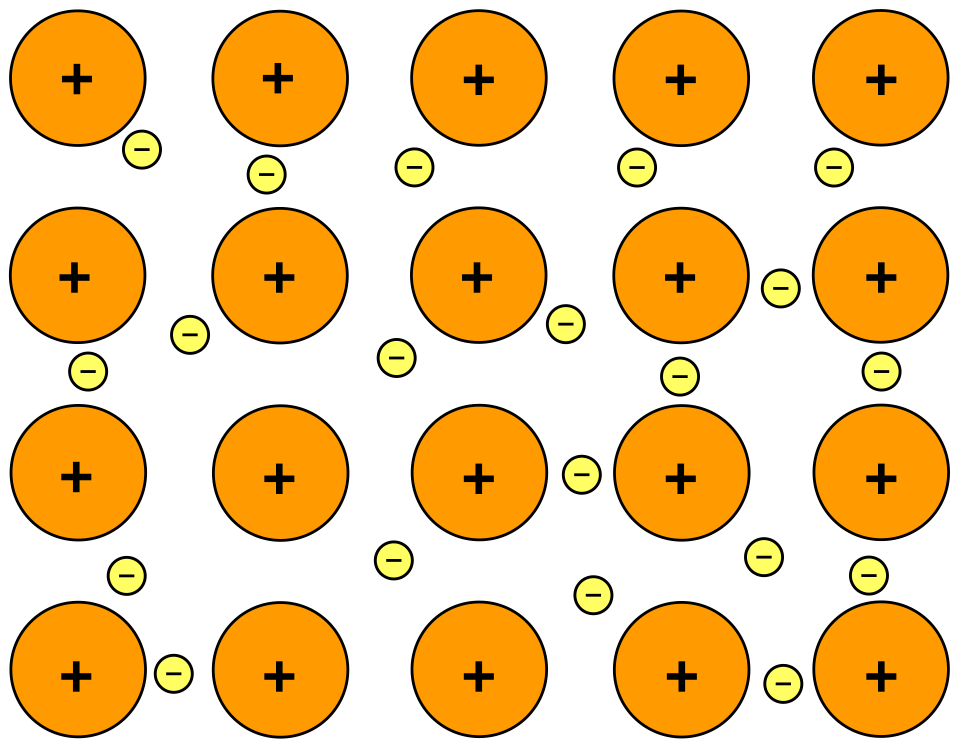
Describe how valence electrons are represented in the model.
Explain why this model can account for electrical conductivity in a metallic solid.
Make a claim about whether the model is more consistent with metallic bonding or covalent bonding. Justify your claim.
Question 6
The diagram below compares three particulate models: a pure metal, a substitutional alloy, and an interstitial alloy. The different sphere sizes represent atoms with different radii.
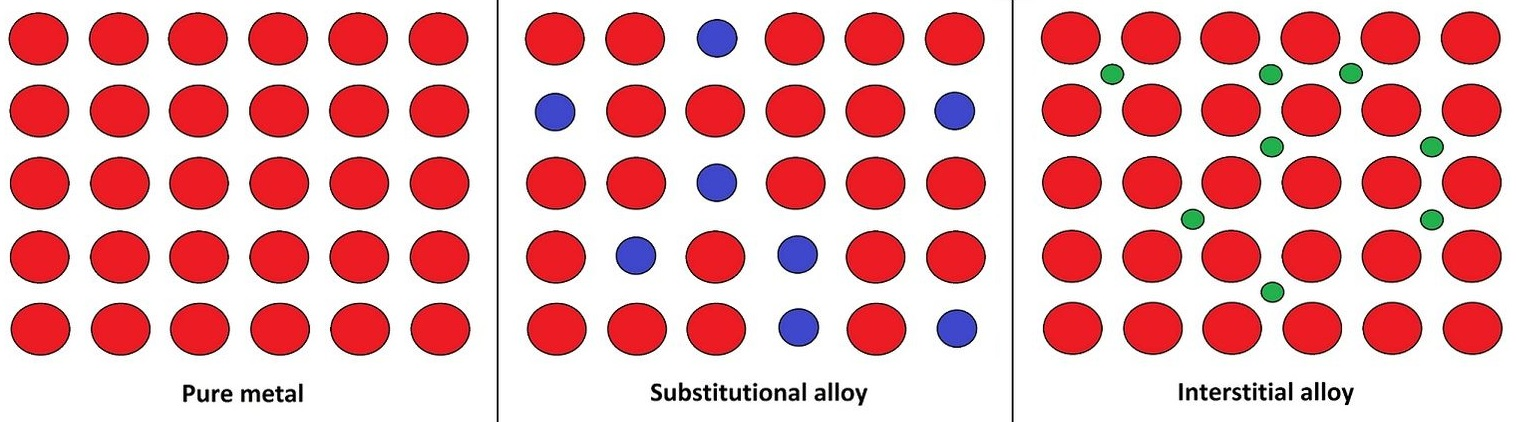
Identify which model represents an interstitial alloy.
Explain why atoms with significantly smaller radii are more likely to form an interstitial alloy than a substitutional alloy.
Predict which type of alloy is more likely when two metallic atoms have comparable radii. Justify your answer.
Question 7
The image below shows bond distances and bond angles in a molecule of formaldehyde, . The carbon atom is bonded to two hydrogen atoms and one oxygen atom.
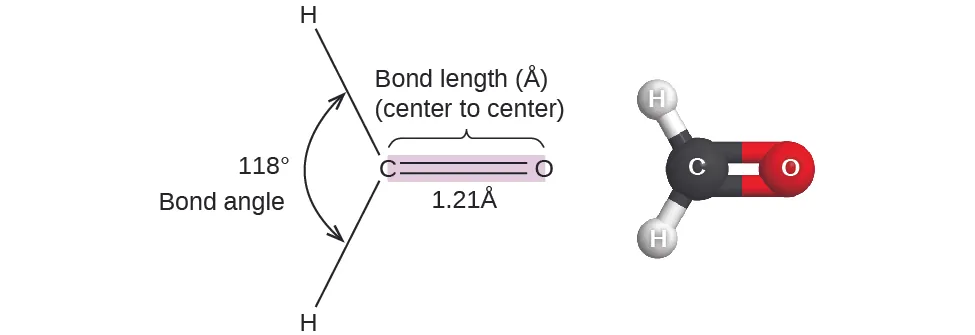
Determine the electron-region geometry around the carbon atom.
Explain why the region containing the bond affects the bond angles around carbon.
Predict the hybridization of the carbon atom.
Question 8
The image below shows several molecular shapes predicted from the number of bonding regions and lone pairs around a central atom.
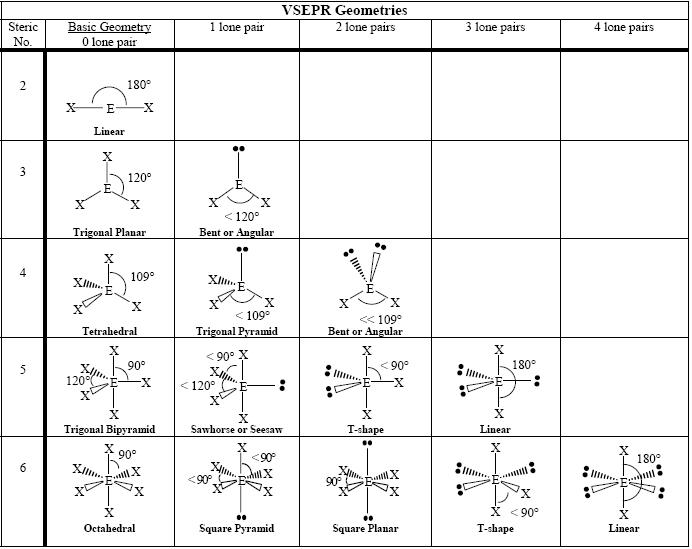
Determine the molecular geometry for a molecule with three bonding regions and one lone pair on the central atom.
Explain why the molecular geometry is not tetrahedral even though there are four regions of electron density.
Predict whether the bond angle is equal to or less than . Justify your answer.
Question 9
The source below shows possible Lewis structures for carbon dioxide, . Each structure uses the same atoms but differs in the arrangement of bonds.
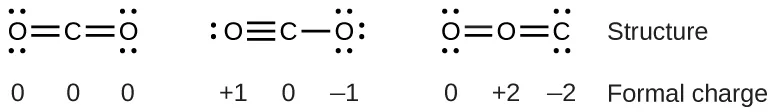
Identify the Lewis structure that is the best model for .
Justify your choice using formal charge.
Explain why formal charge is useful when more than one valid Lewis diagram can be drawn.
Question 10
The source below shows resonance structures for the nitrite ion, . The two structures have the same arrangement of atoms but differ in the placement of the double bond.
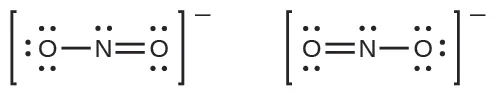
Describe why the two Lewis structures are considered resonance structures.
Explain why the actual bonds in are expected to be equivalent.
Make a claim about whether the ion rapidly switches back and forth between the two Lewis structures. Justify your claim.