
Question 1
A jet-powered car moves along a straight track. The graph below shows the car’s position as a function of time while the car moves with constant velocity.
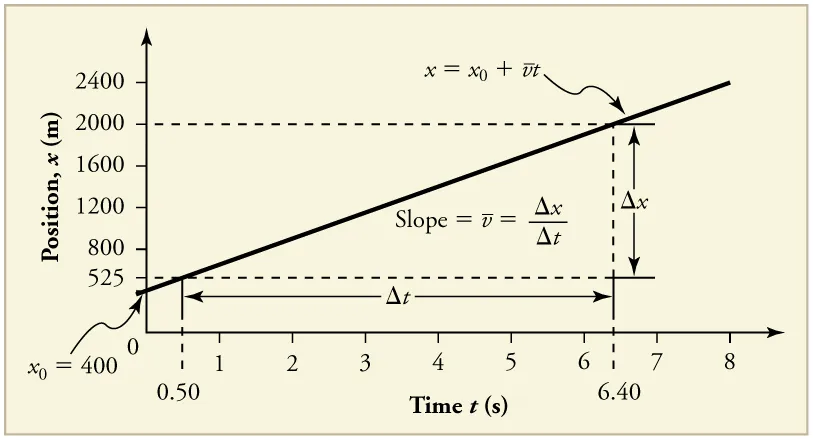
Calculate the average velocity of the car using two labeled points on the graph.
Determine whether the car’s acceleration is zero, positive, or negative during the interval shown. Justify your answer using the graph.
Sketch a velocity–time graph for the same interval.
Question 2
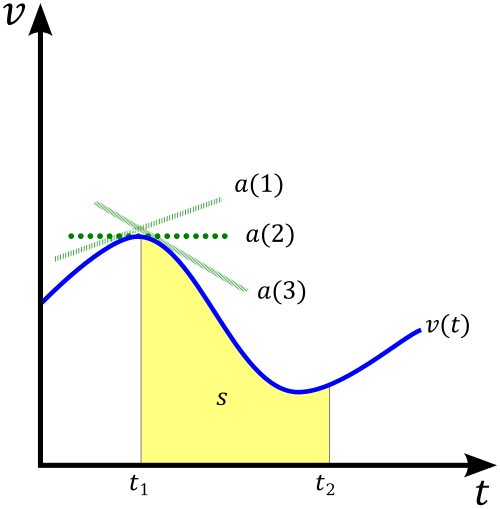
A car moves in one dimension with constant acceleration. The graphs below show position, velocity, and acceleration as functions of time for the same motion.
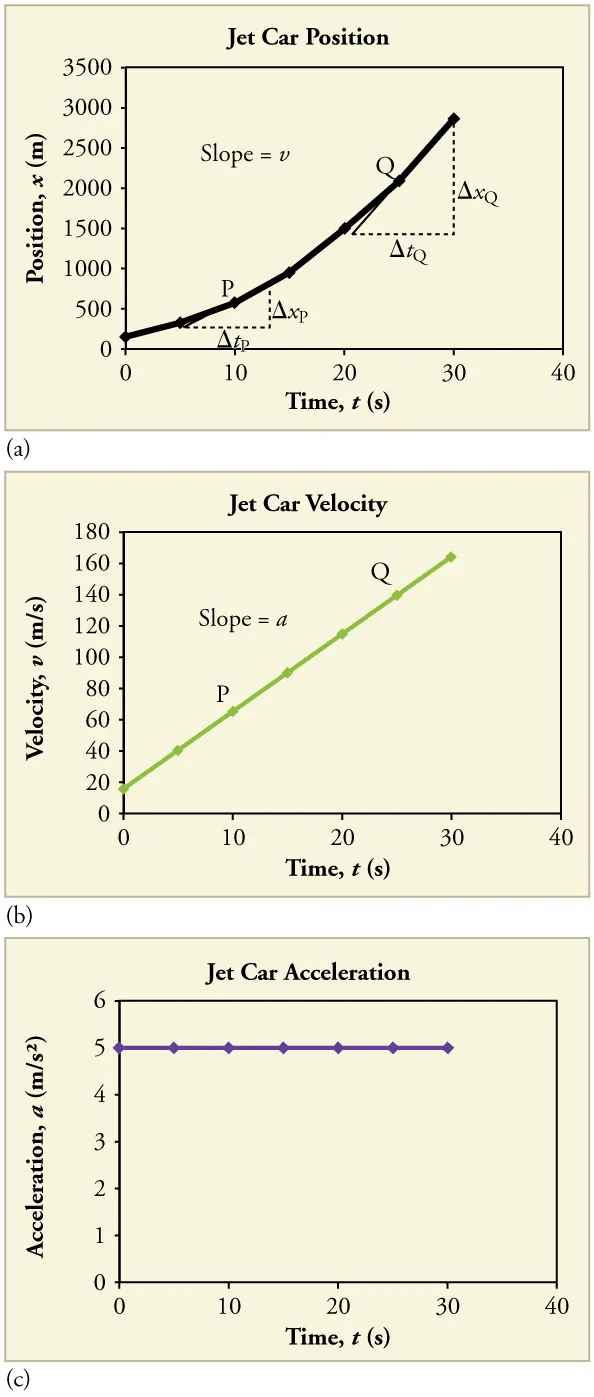
Describe how the shape of the position–time graph shows that the car’s velocity is increasing.
Determine the sign of the acceleration. Justify your answer using the velocity–time graph.
Compare the information given by the slope of the velocity–time graph and the area under the acceleration–time graph.
Question 3
A cart moves along a straight horizontal track. A motion sensor records the cart’s position as a function of time. The results are shown in the graph below.
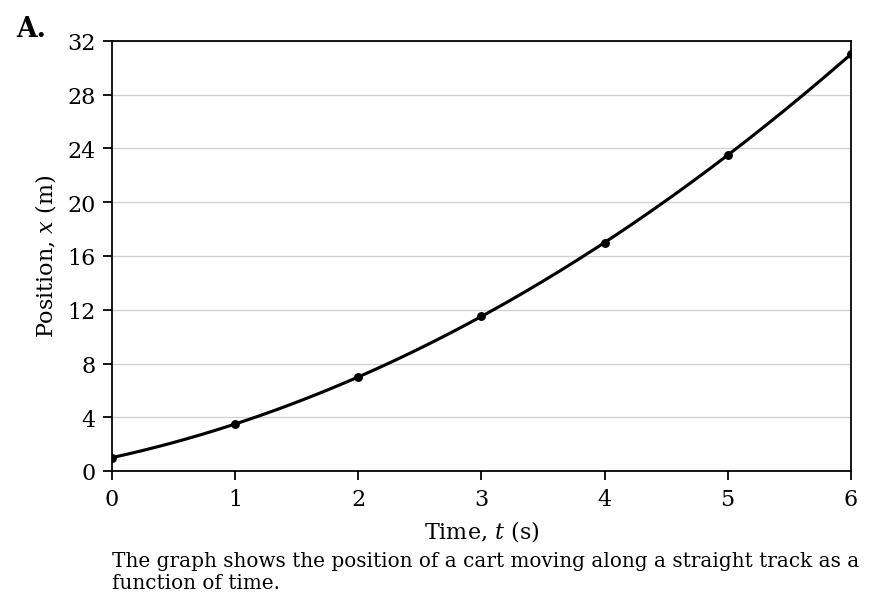
Determine the cart’s average velocity from to .
Describe how the velocity of the cart changes during the time interval shown.
Justify whether the cart’s acceleration is positive, negative, or zero.
Derive an expression for using the form .
Question 4
An object moves along the -axis. Its velocity is recorded as a function of time. The graph below shows the object’s motion.
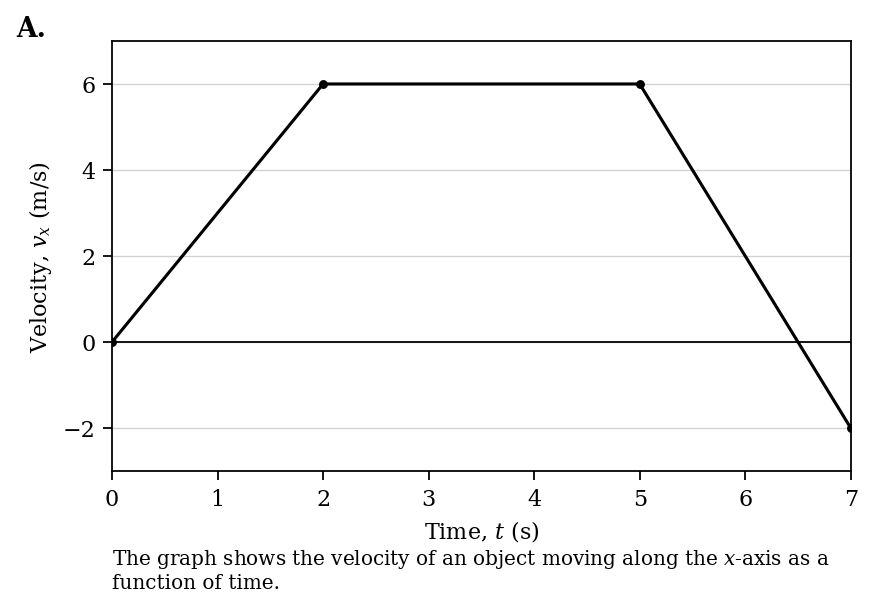
Calculate the displacement of the object from to .
Determine the acceleration of the object from to .
Compare the motion of the object during the intervals to and to .
Justify whether the object changes direction during the time interval shown.
Question 5
Two balls are released at the same time from the same height. One ball is dropped from rest, and the other ball is given an initial horizontal velocity. The strobe image below shows their positions at equal time intervals. Air resistance is negligible.
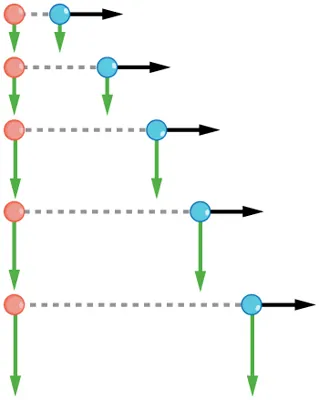
Compare the vertical positions of the two balls at equal times.
Justify why the ball with horizontal velocity lands at the same time as the ball dropped from rest.
Determine whether the horizontal velocity of the thrown ball increases, decreases, or remains constant. Justify your answer.
Question 6
A projectile is launched from the ground with an initial velocity at an angle above the horizontal. The diagram below shows the projectile’s path and velocity components at selected points. Air resistance is negligible.
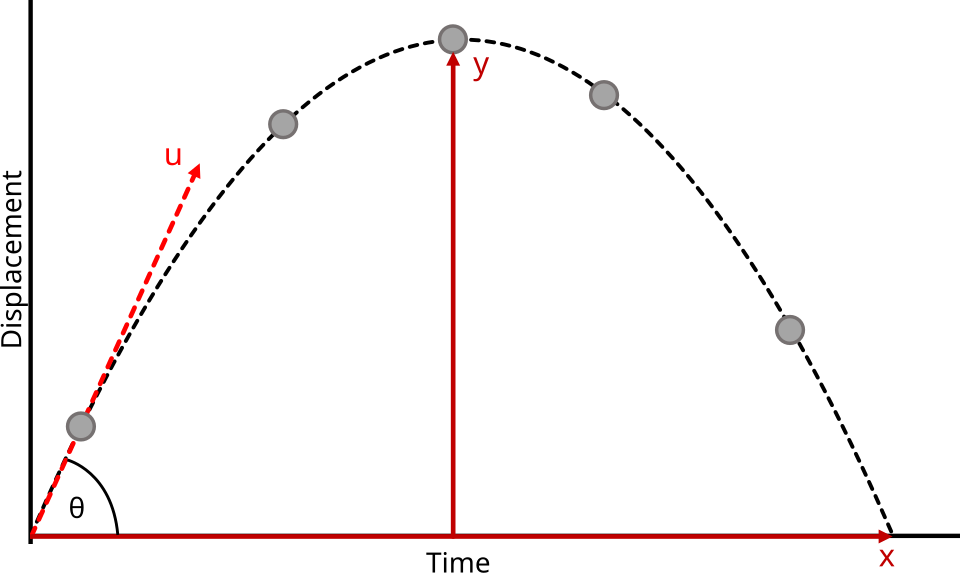
Describe how the horizontal component of velocity changes during the motion.
Determine the direction of the acceleration at the highest point of the path. Justify your answer.
Compare the vertical component of velocity just after launch with the vertical component of velocity just before landing, assuming launch and landing occur at the same height.
Question 7
The diagram below shows ideal projectile paths for objects launched at the same speed but at different angles above the horizontal. Air resistance is negligible, and each object lands at the same vertical height from which it was launched.
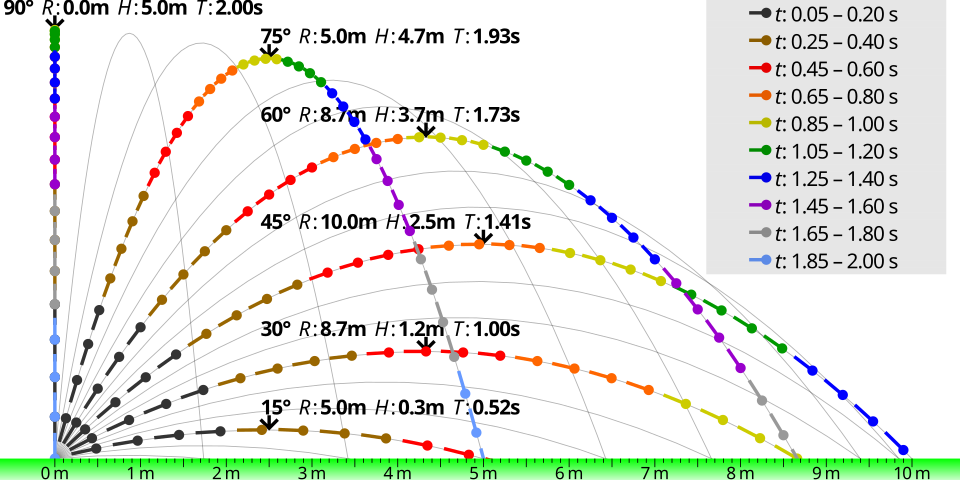
Compare the horizontal ranges for two complementary launch angles shown in the diagram.
Justify why the path with the larger launch angle has a greater maximum height than the path with the smaller launch angle.
Predict how the time of flight changes as the launch angle increases, assuming the launch speed stays constant.
Question 8
A displacement vector is represented by two perpendicular components in the diagram below. The horizontal component has magnitude , the vertical component has magnitude , and the resultant vector has magnitude .
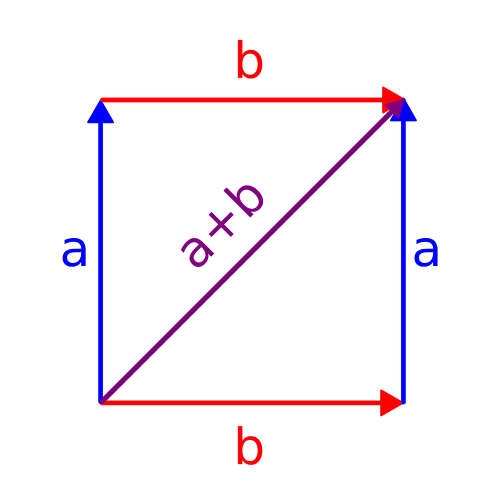
Derive an expression for the magnitude of the resultant vector in terms of and .
Determine the direction angle of the resultant vector measured from the horizontal component.
Justify why the components can be analyzed independently.
Question 9
A boat points directly across a river while the river current moves to the right. The diagram below shows the boat’s velocity relative to the water, the river’s velocity relative to the shore, and the boat’s resultant velocity relative to the shore.
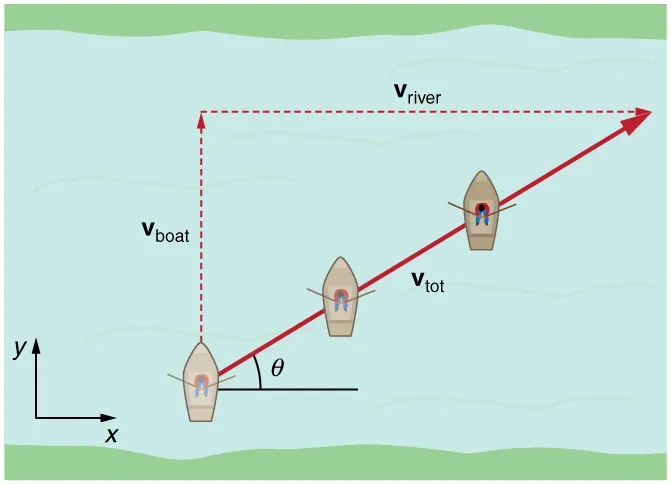
Determine the direction of the boat’s velocity relative to the shore.
ustify why the boat does not move in the direction it points, as measured by an observer on the shore.
Describe how the resultant velocity would change if the river current increased while the boat’s velocity relative to the water stayed the same.
Question 10
The graph below shows velocity as a function of time for an object moving in one dimension. The object’s velocity changes during the interval shown.
Determine the sign of the acceleration during the interval where the velocity increases.
Calculate the displacement during a time interval by describing how the area under the velocity–time graph would be used.
Justify whether a velocity–time graph can show an object moving in the negative direction.