

Question 1
The diagram below shows a rock launched from a volcano with an initial speed of at an angle of above the horizontal. The rock lands at a point below its launch point. Air resistance is negligible, and .
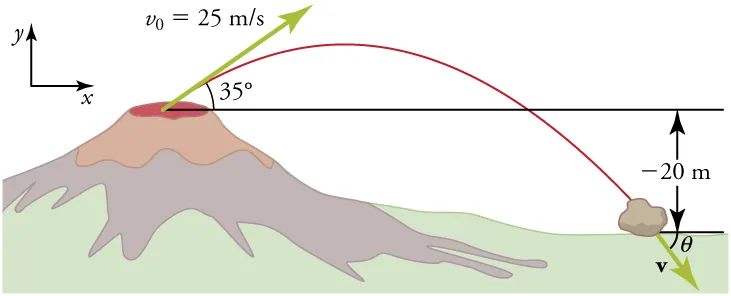
Let the launch point be the origin, with the positive -direction horizontal and the positive -direction upward. Let represent the vertical distance by which the landing point is below the launch point.
Draw the initial velocity components and the acceleration vector on a simplified sketch of the rock immediately after launch. Label the relevant quantities.
Derive an expression for the positive time at which the rock reaches a point that is a distance below the launch point. Express your answer in terms of , , , and .
Calculate the rock’s time of flight for the situation shown.
Calculate the horizontal displacement of the rock.
Calculate the magnitude and direction of the rock’s velocity immediately before impact.
Suppose the terrain is changed so that the rock lands at the same vertical height from which it was launched, while and remain unchanged.
Determine whether the new impact speed is less than, equal to, or greater than the impact speed calculated in part (c)(iii).
Justify your answer using the horizontal and vertical components of velocity.
Question 2
The photograph below was produced using a stroboscopic flash operating at . Successive appearances of the ball therefore represent equal time intervals. For this question, consider one complete airborne arc between consecutive contacts with the floor. Treat the ball as an ideal projectile while it is airborne, neglect air resistance, and take the motion to be from left to right.
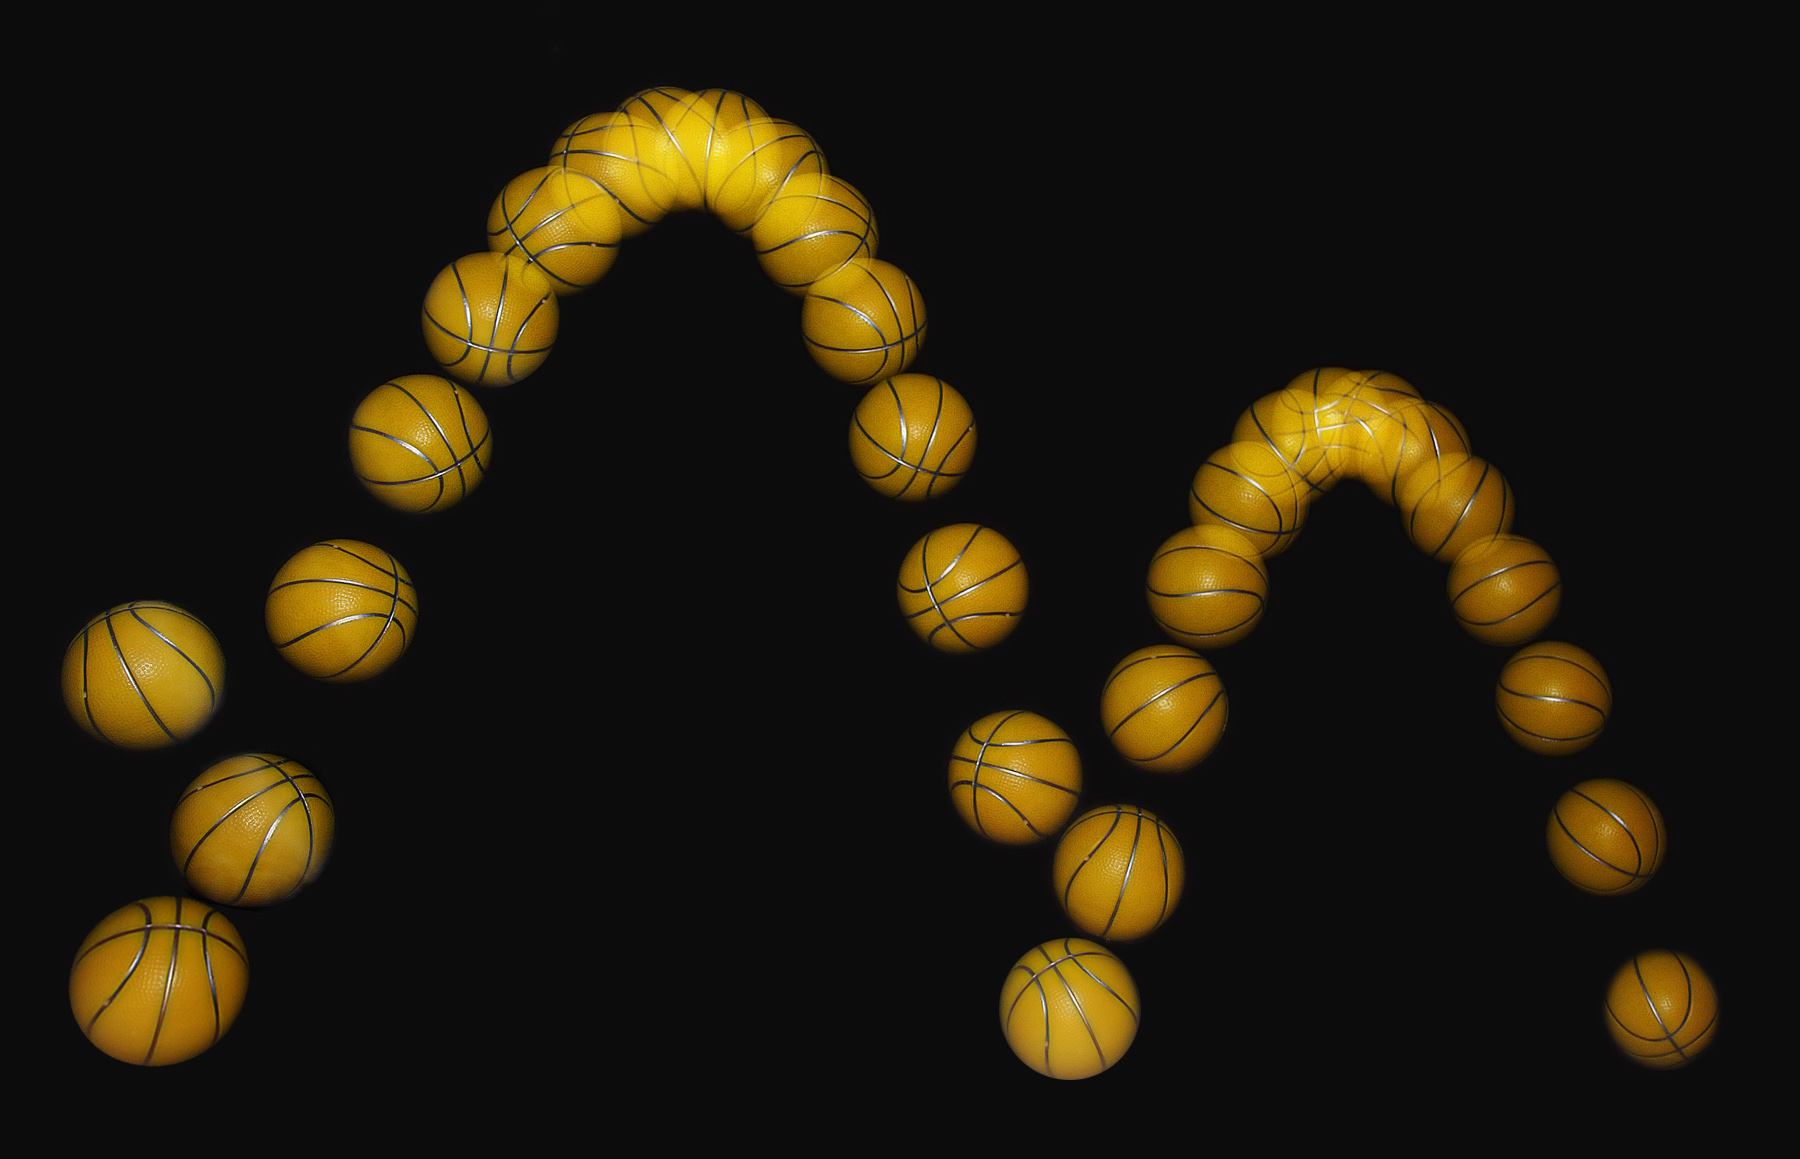
Draw the velocity vector at one of the ball positions on the ascending portion of an arc. Resolve the vector into labelled horizontal and vertical components.
Sketch a graph of vertical velocity as a function of time from immediately after one bounce until immediately before the next bounce. Indicate the instant at which the ball reaches its maximum height.
Sketch the corresponding graph of vertical position as a function of time . Show how the graph is consistent with your answer to part (b)(i).
Let be the flash frequency and let be the horizontal distance between successive recorded positions.
Derive an expression for in terms of the horizontal velocity and .
Determine the time interval between successive recorded positions.
Justify why the horizontal spacing is approximately constant while the vertical spacing changes throughout an arc.
The flash frequency is doubled without changing the ball’s motion.
Determine how the horizontal spacing and the number of recorded positions during one arc change.
Justify whether the physical trajectory of the ball changes.
Question 3
The photograph below shows a photogate-style timing device. A low-friction cart fitted with an opaque flag can pass through such a device. The time for which the flag interrupts the beam can be used to determine the cart’s instantaneous speed.
Students have an adjustable track, a cart, an opaque flag of known length, a photogate, a metre rule, an angle-measuring device, and a reproducible release mechanism.
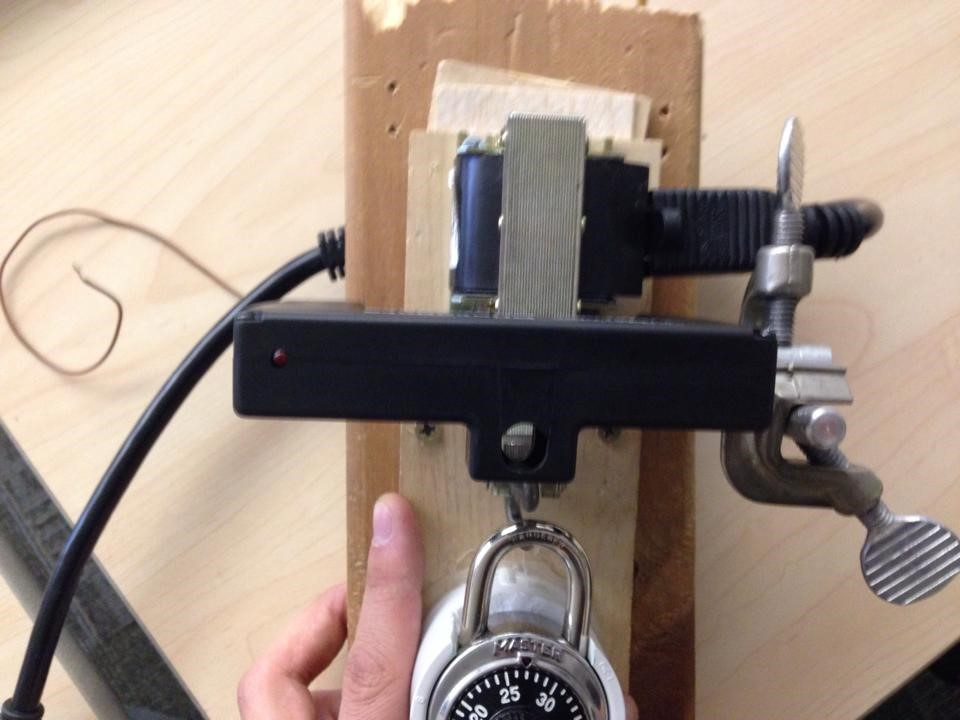
A student wants to investigate the relationship between the speed of a cart released from rest on a fixed incline and the displacement travelled by the cart.
Indicate the independent variable, the dependent variable, and the measurements needed to obtain each variable.
Describe a repeatable experimental procedure. Include how the photogate is used and identify important variables that must be controlled.
Describe a graph that can be used to determine the cart’s acceleration and test whether the acceleration is constant.
A different student group performs a similar investigation. In this investigation, the cart has a nonzero initial speed at . The following measurements are obtained.
Trial 1: ; .
Trial 2: ; .
Trial 3: ; .
Trial 4: ; .
Trial 5: ; .
Trial 6: ; .
Plot on the vertical axis as a function of on the horizontal axis. Label both axes with units, use sensible linear scales, plot all six data points, and draw a best-fit line.
Determine the cart’s acceleration from the graph.
Determine the cart’s initial speed at .
Verify whether the data support a constant-acceleration model.
Question 4
The diagram below shows a ball launched from level ground with initial speed at an angle above the horizontal. The positive -direction is horizontal, and the positive -direction is upward. Air resistance is negligible.
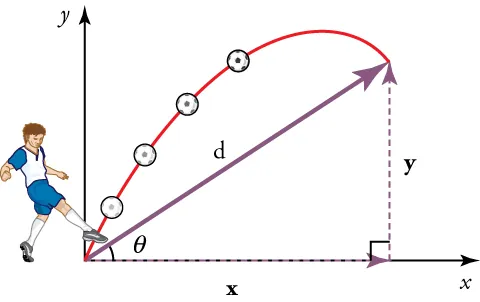
Determine the direction of the ball’s velocity at the highest point of its trajectory.
Justify why the velocity has the direction given in part (a) even though the acceleration is nonzero at that point.
Derive an equation for the ball’s vertical position as a function of its horizontal position . Express your answer in terms of , , , and .
A second ball is launched at the same angle, but with initial speed .
Determine whether the second ball is above, below, or at the same vertical position as the first ball when both have reached the same horizontal position .
Justify your answer using the equation derived in part (c).
Question 5
An object moves along a straight horizontal axis. The graph below shows the object's velocity as a function of time . Straight-line segments connect the plotted vertices. At , the object is at .
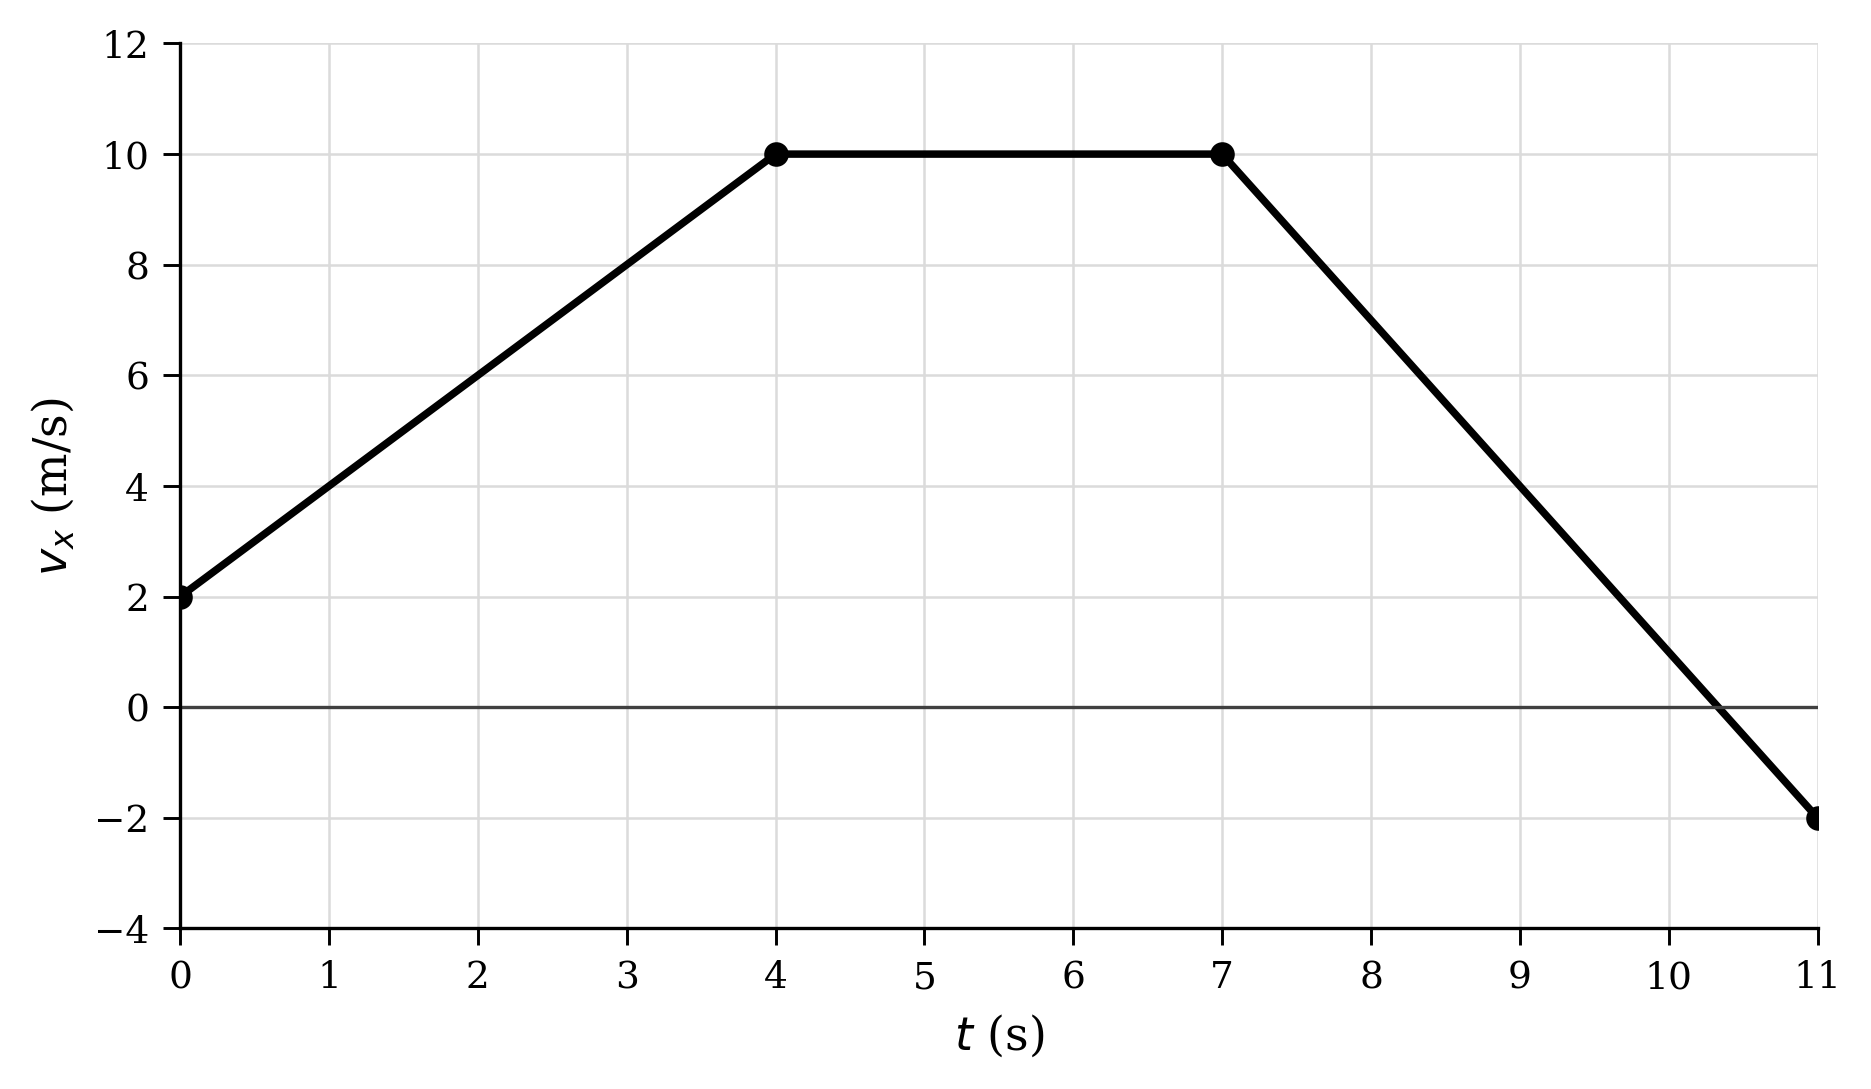
Determine the object's acceleration during .
Calculate the object's displacement during .
Determine the time at which the object reverses direction during .
Derive an expression for the object's position during . Your expression must use the graph and the given initial position.
Calculate the object's position at .
Compare the object's average speed with the magnitude of its average velocity during .
Justify your comparison using evidence from the graph.
Question 6
An object moves in one dimension with constant acceleration. The graph below shows its position as a function of time from to .
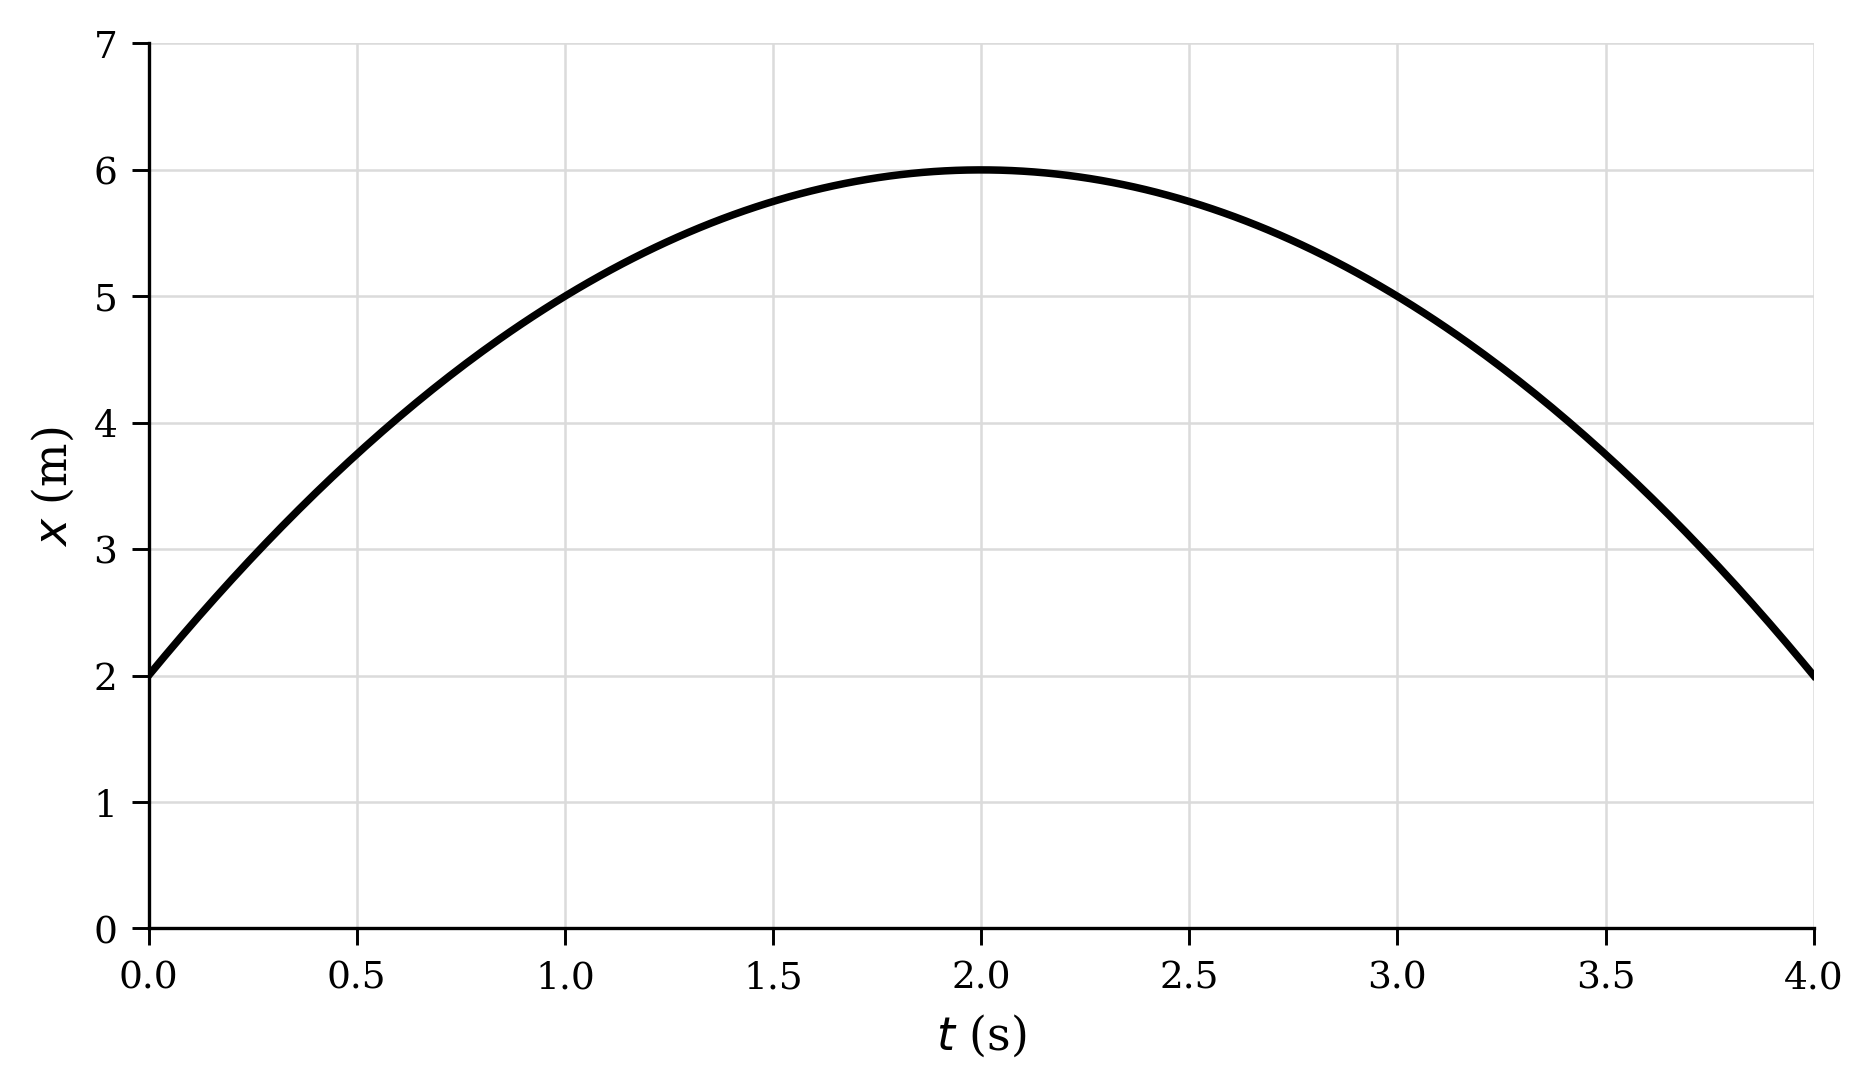
Determine the object's average velocity during .
Estimate the object's instantaneous velocity at by using graph values on either side of that time.
Draw a motion diagram for the object at , , , , and . Show position dots, velocity arrows, and acceleration arrows.
Derive the object's initial velocity and acceleration by using the graph values at , , and with a constant-acceleration relationship.
Sketch the corresponding graph of velocity as a function of time from to . Include numerical intercepts and the zero crossing.
Justify why the maximum of the provided position graph is consistent with your velocity graph.
Determine the time at which the object would first stop if its initial velocity were doubled while its acceleration and initial position remained unchanged.
Question 7
A group calibrates a motion sensor before studying a cart. For each calibration point, is the distance measured with a metre ruler and is the simultaneous sensor reading. The plotted points and best-fit line are shown below.
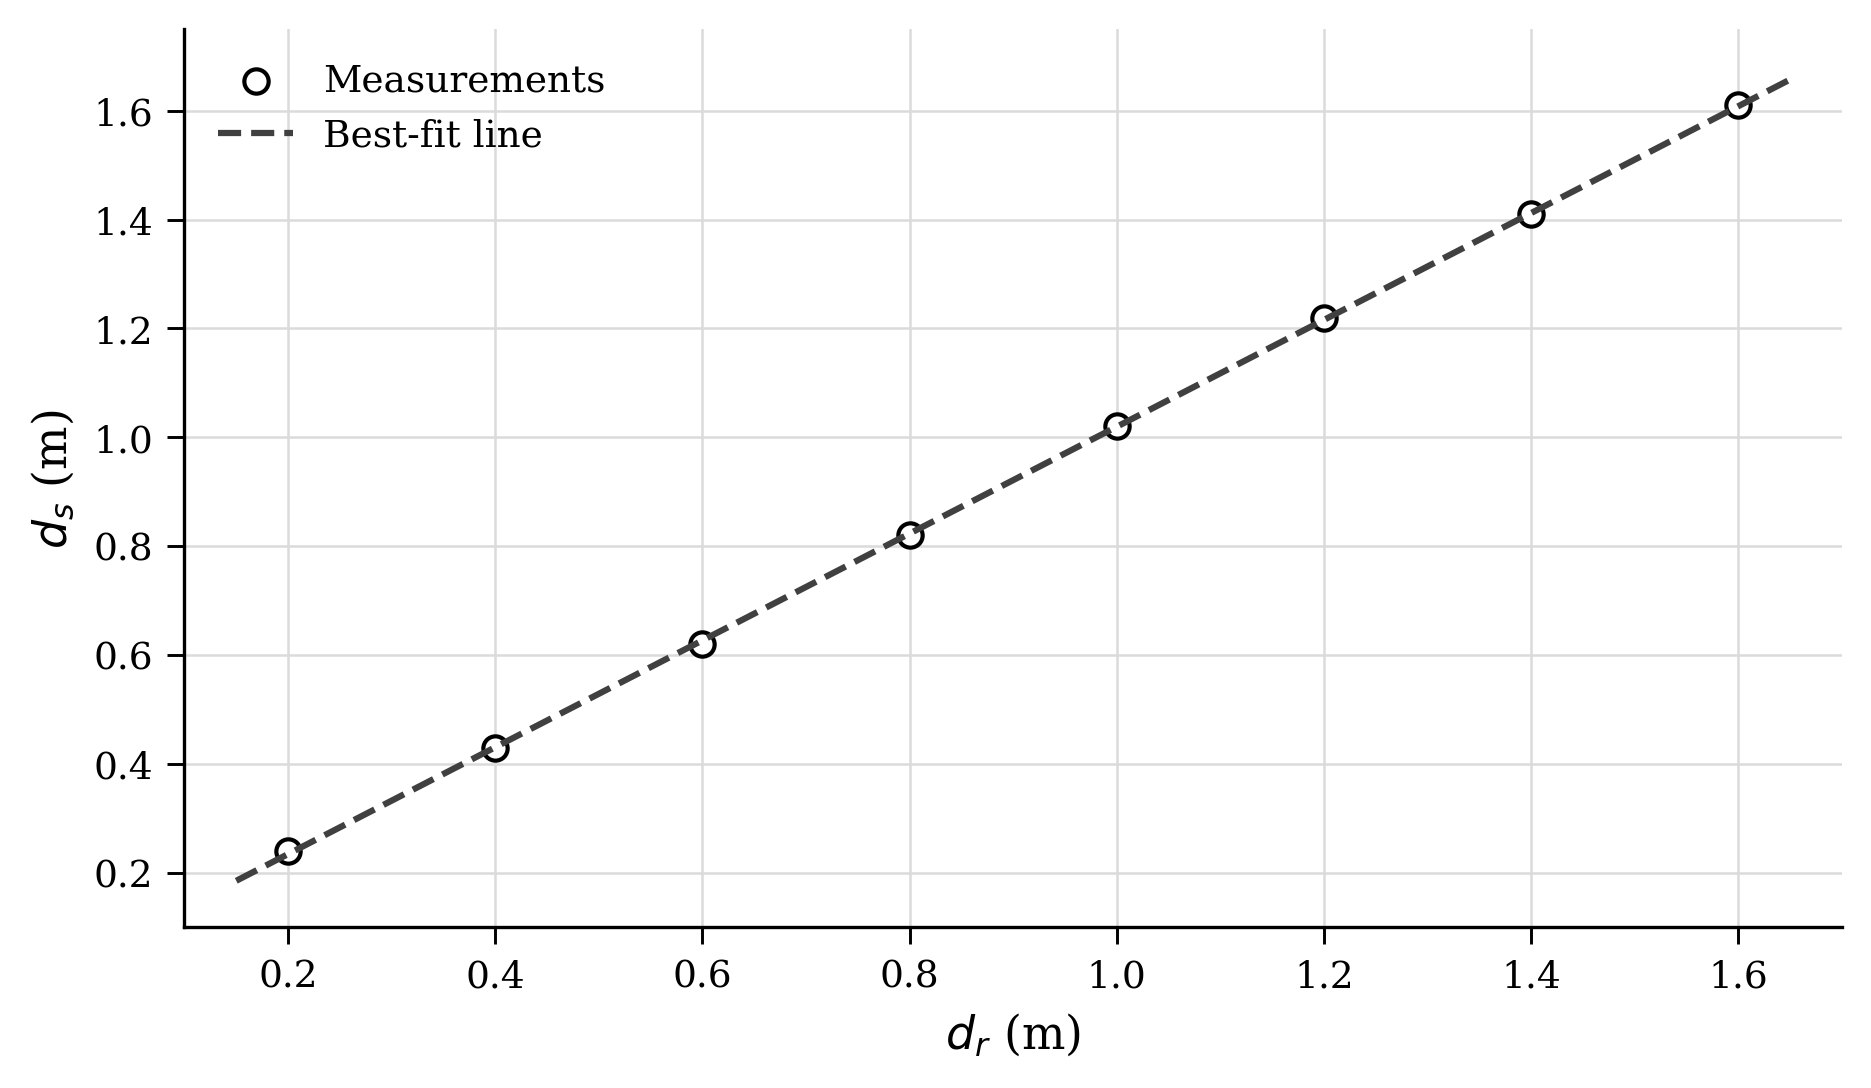
Determine the ruler distance that corresponds to a sensor reading of .
Describe a feasible procedure that uses the calibrated motion sensor to determine whether a cart moving along a straight track has constant acceleration and to measure that acceleration.
Describe important controls and repeated measurements that would improve the investigation.
Describe the graph that should be produced from the measured motion data and how the acceleration would be obtained from that graph.
In a related investigation, a cart is released from rest and its corrected position is recorded at several times.
Trial 1: ; .
Trial 2: ; .
Trial 3: ; .
Trial 4: ; .
Trial 5: ; .
Trial 6: ; .
Calculate the value of for Trial .
Plot on the vertical axis as a function of on the horizontal axis. Label both axes with units, use a sensible scale, plot all six points, and draw a best-fit line.
Determine the cart's acceleration from the slope of the best-fit line.
Justify whether the data are consistent with constant acceleration.
Question 8
A vehicle moves on a straight road and then brakes with the same constant acceleration magnitude in every trial until it stops. The graph below shows stopping distance as a function of initial speed . Reaction distance is not included.
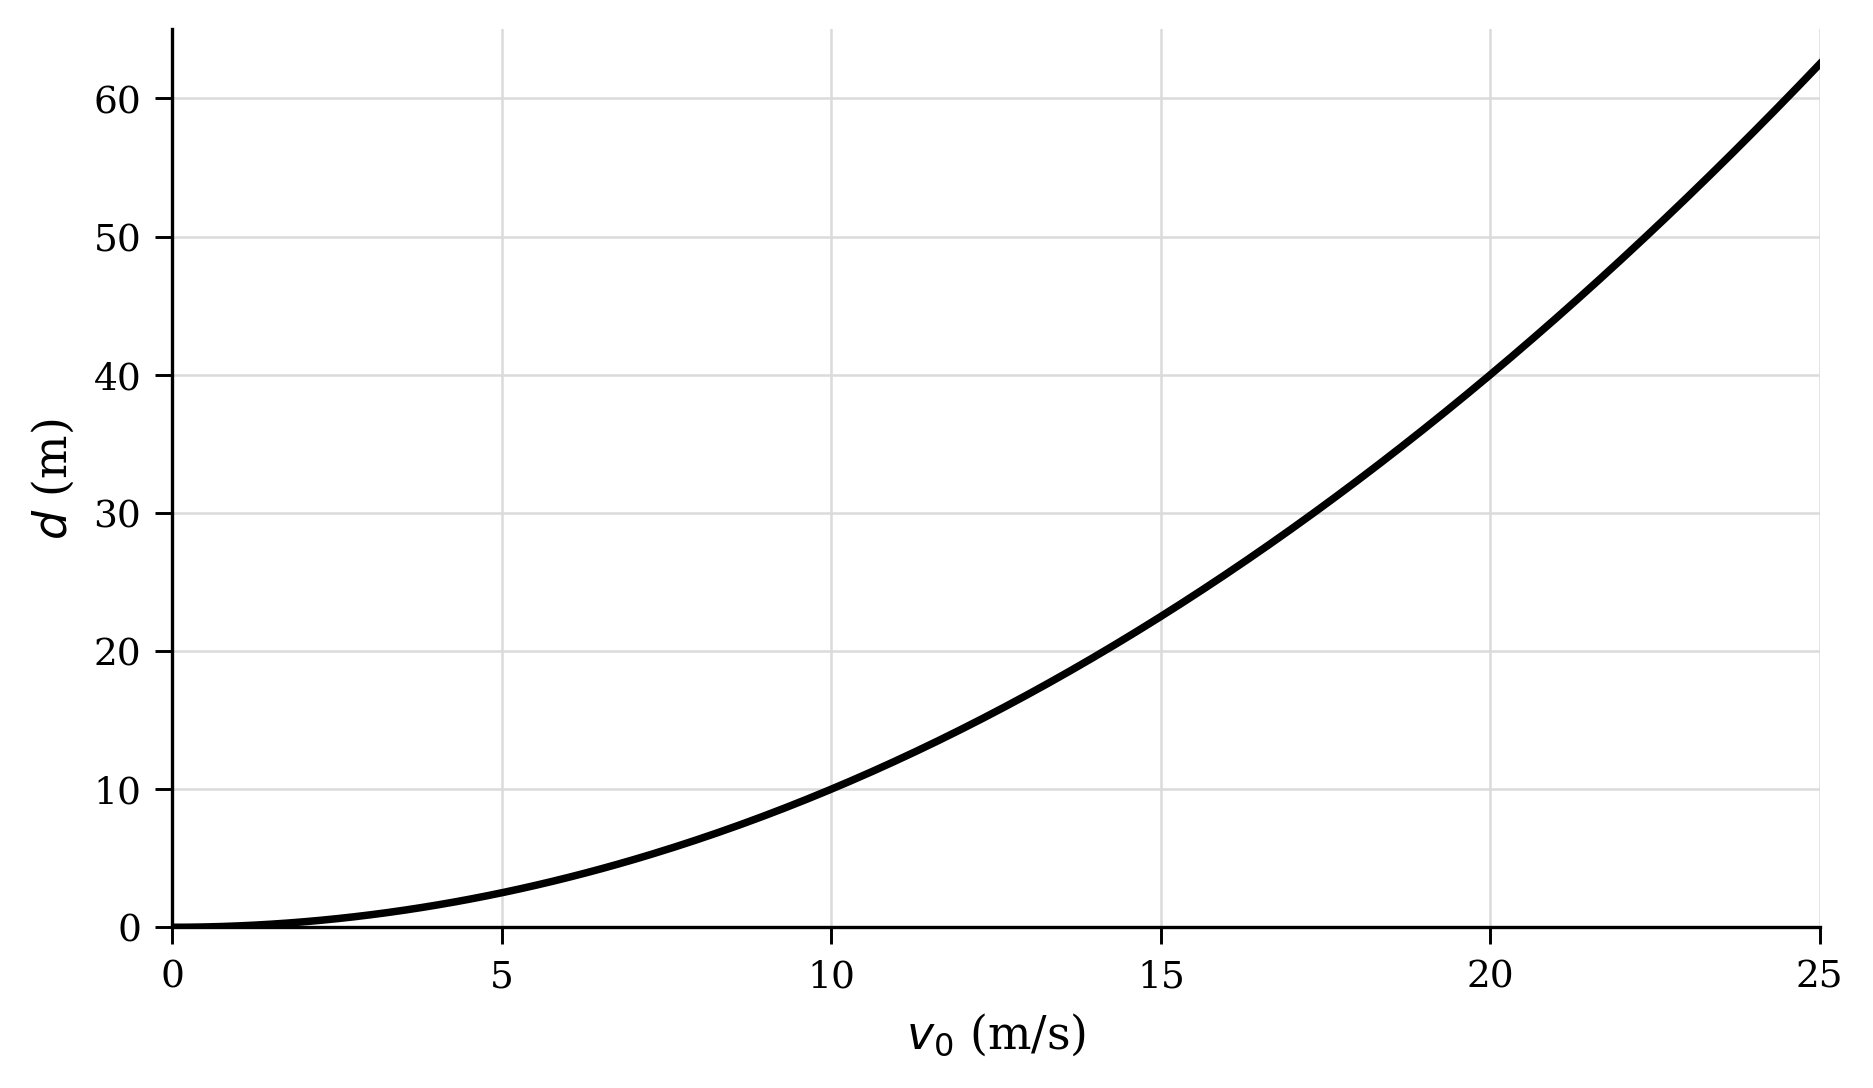
Compare the increase in stopping distance from to with the increase from to .
Justify the curved shape of the graph by applying a constant-acceleration kinematic relationship.
Derive an expression for in terms of and .
Calculate the acceleration magnitude by using the point on the graph at .
Determine the factor by which changes when is multiplied by .
Verify the statement that doubling the initial speed requires four times the stopping distance under the stated conditions.
Question 9
A projectile is launched from the edge of a cliff. Its horizontal velocity component remains . The graph below shows the vertical velocity component from launch at until impact at . Air resistance is negligible.
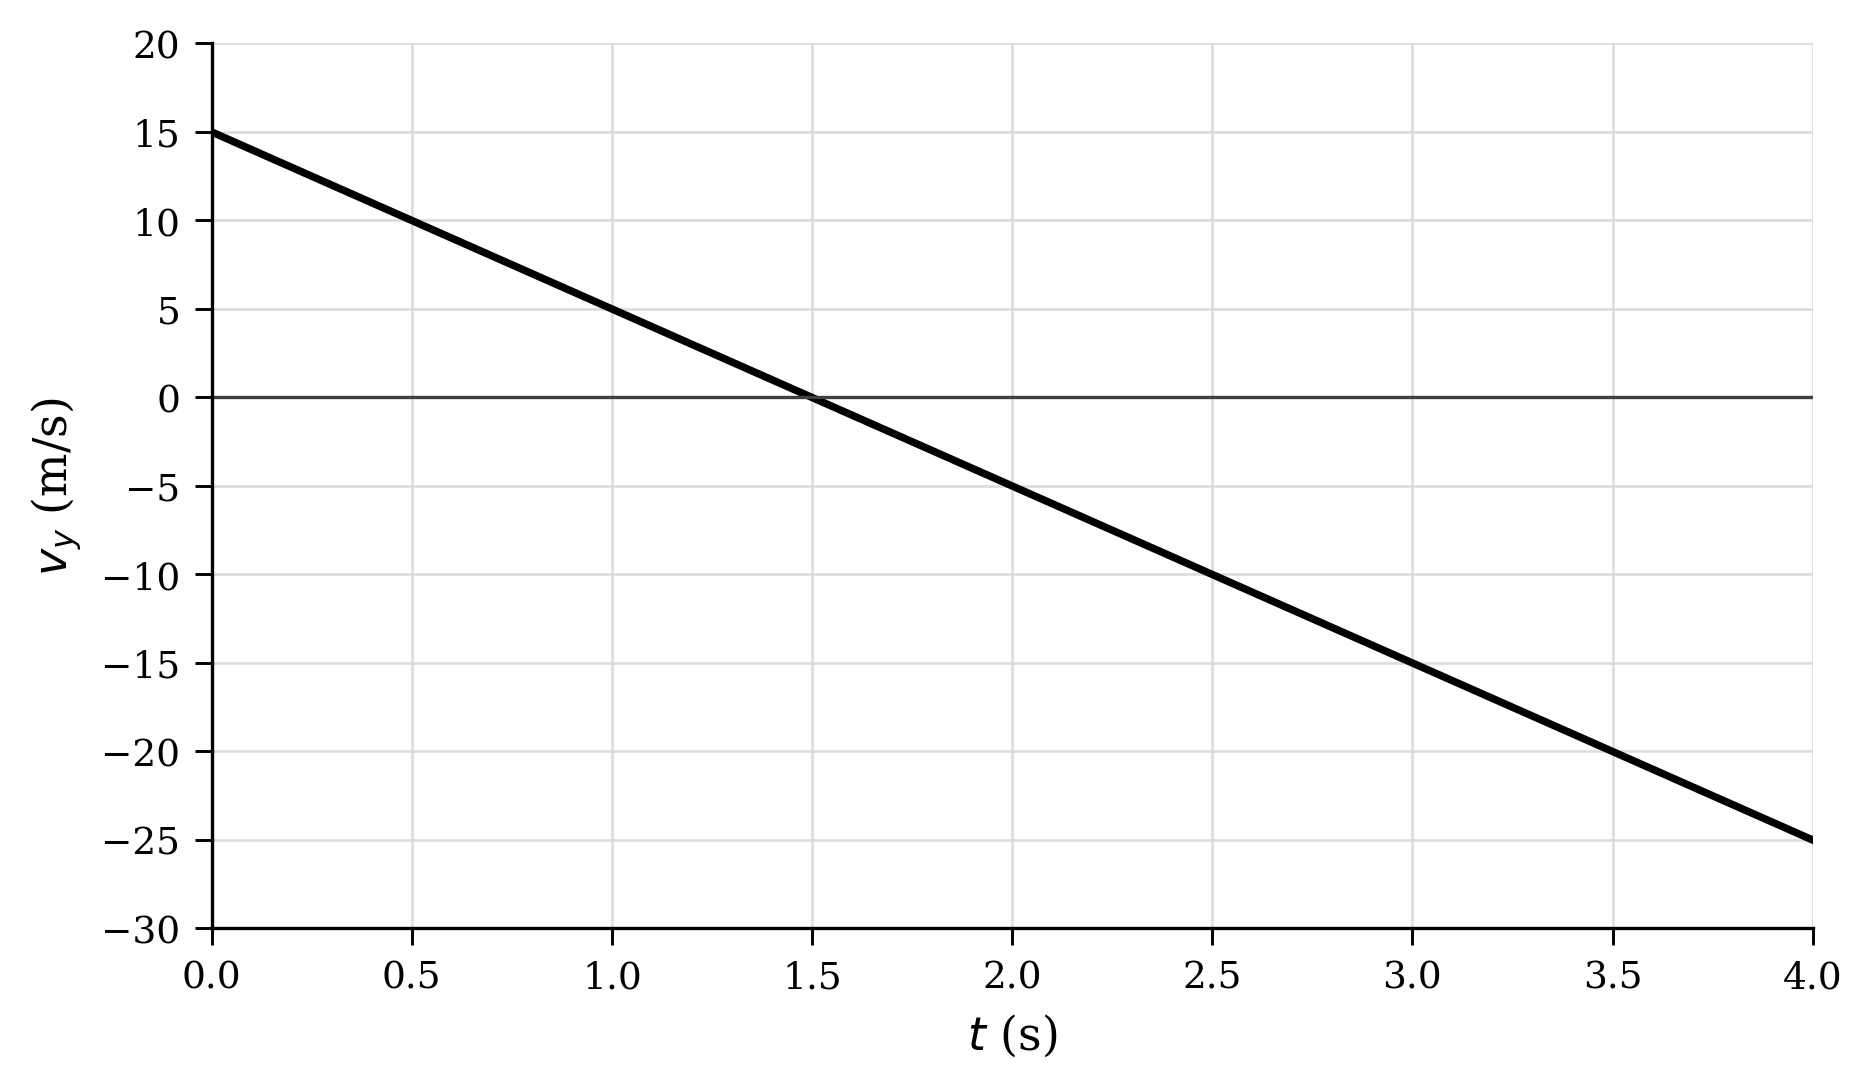
Determine the projectile's vertical acceleration.
Determine the time at which the projectile reaches its highest point.
Calculate the projectile's vertical displacement from launch to impact by using signed areas on the graph.
Derive an expression for the maximum vertical displacement above the launch point in terms of the initial vertical speed and the acceleration magnitude . Use the geometry of the graph.
Calculate the maximum vertical displacement above the launch point.
Calculate the horizontal range from launch to impact.
Calculate the magnitude of the projectile's velocity immediately before impact.
Justify whether the magnitude of the projectile's acceleration changes at the highest point.
Question 10
Object and observer move along the same straight axis. The graph below shows their positions in an inertial ground frame . Positive is to the right.
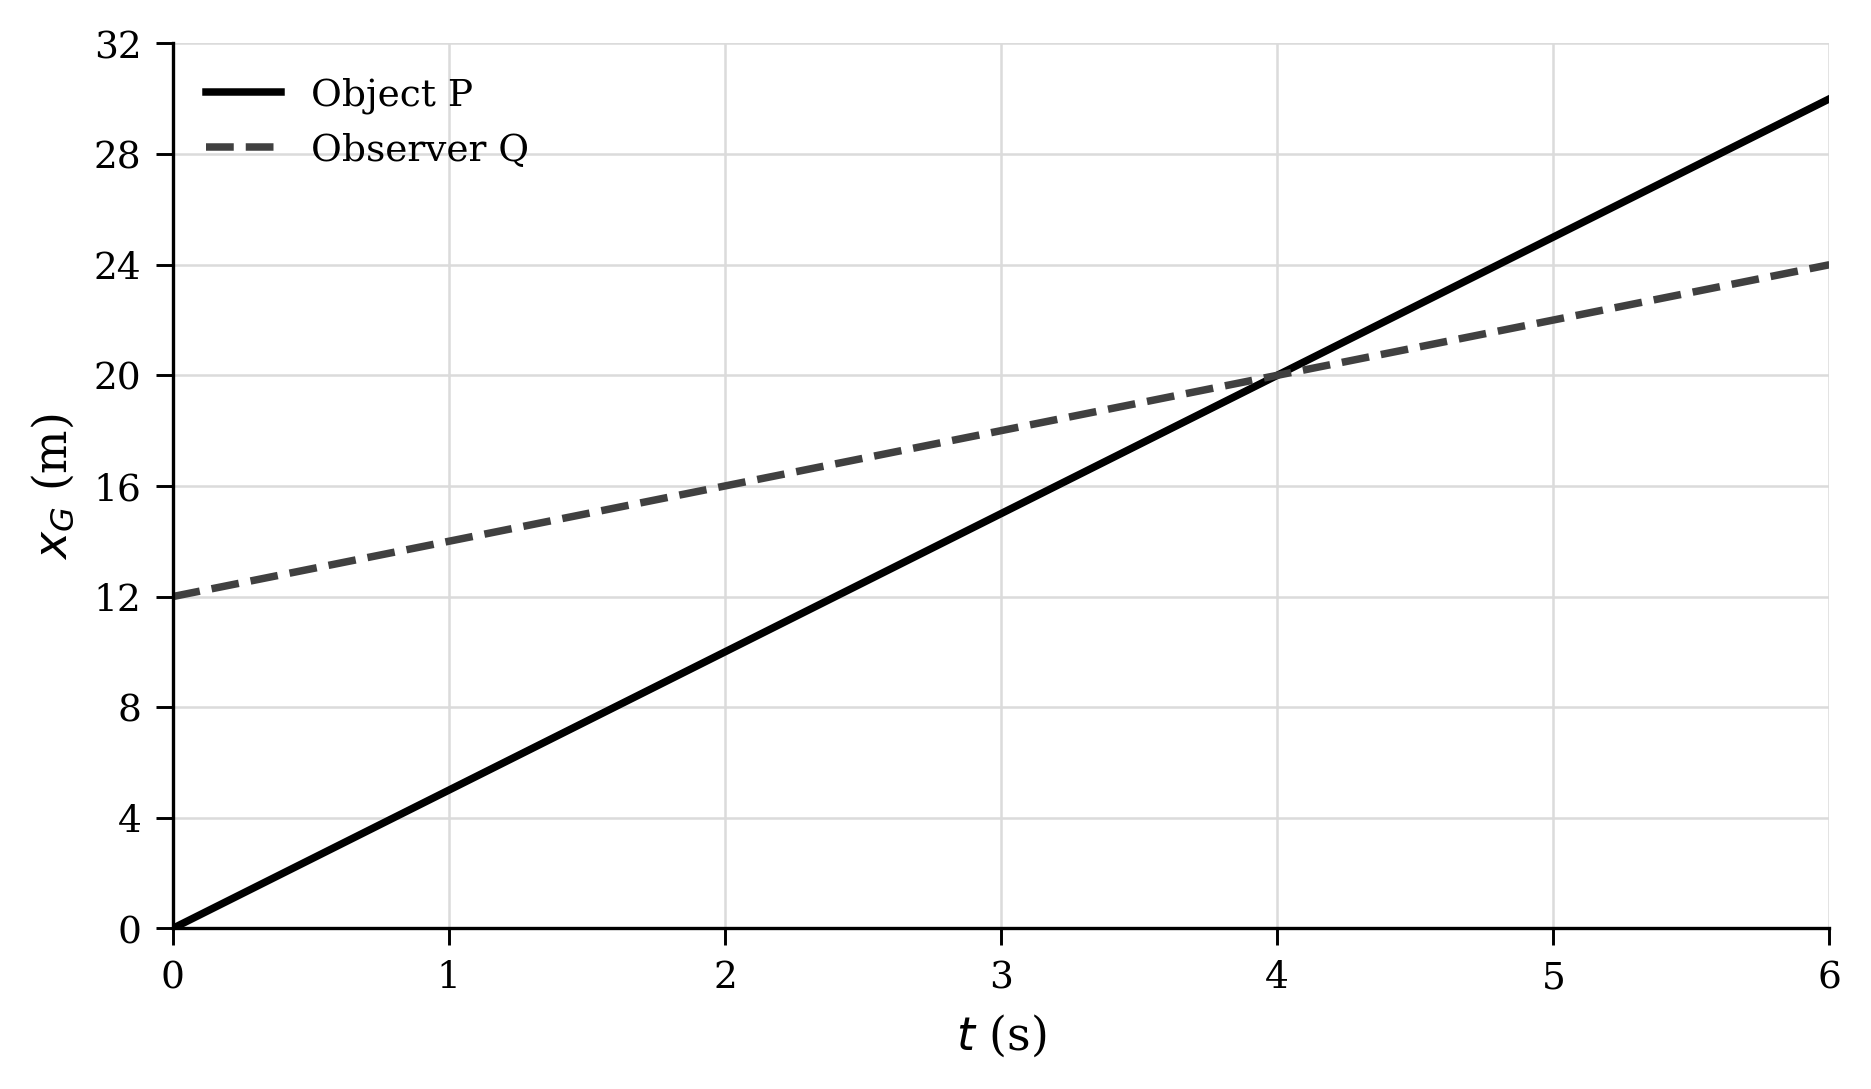
Determine the velocity of object relative to the ground.
Determine the velocity of observer relative to the ground.
Determine the time at which and meet.
Determine their position in the ground frame when they meet.
Draw a one-dimensional vector diagram that represents the relationship among , , and the velocity of relative to .
Derive an expression for the position of relative to by using the intercepts and slopes of the provided graph.
Sketch a graph of as a function of from to . Include the vertical intercept, zero crossing, and value at .
Compare the acceleration of measured in frame with the acceleration of measured in the inertial frame of .
Justify whether observes moving to the right or to the left before they meet.