

Question 1
The diagram below shows two objects of masses and connected by an ideal string that passes over an ideal pulley. The system is released from rest, and . Air resistance is negligible.
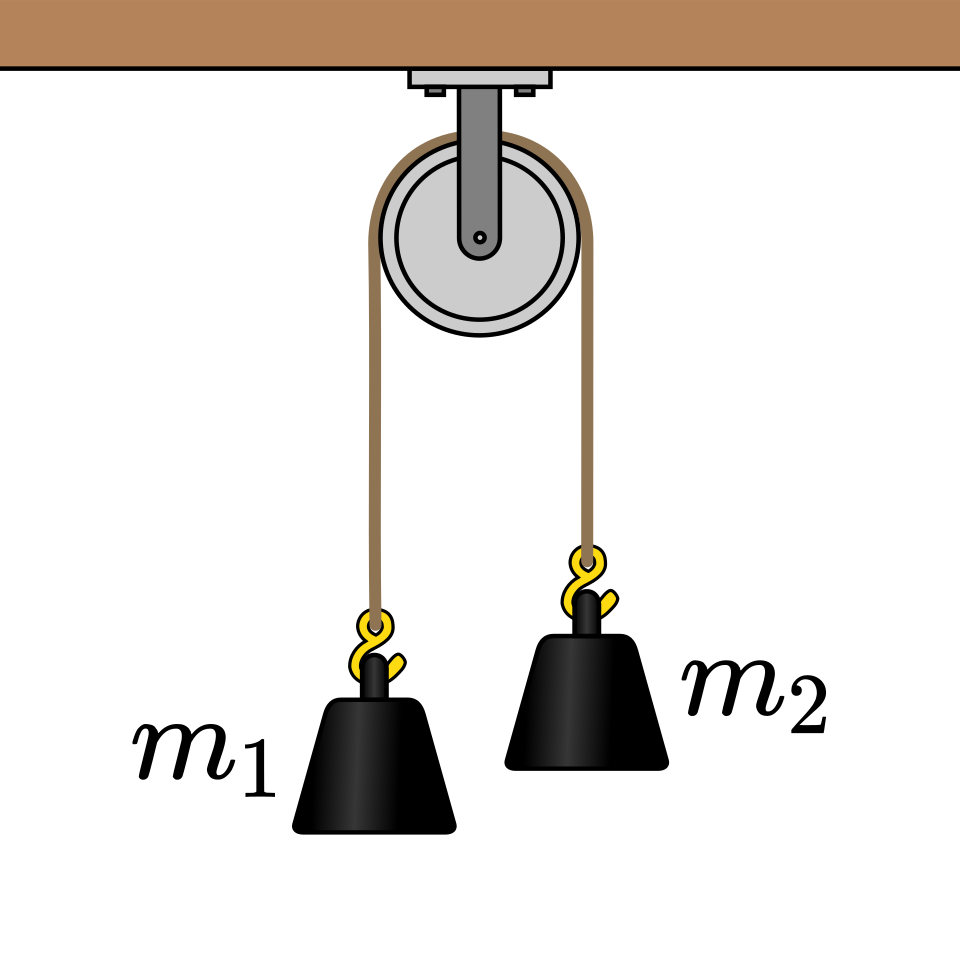
Draw a free-body diagram for each object immediately after the system is released. Each diagram must show and label every force exerted on the object, and the relative arrow lengths must be consistent with the direction of acceleration.
Derive an expression for the magnitude of the acceleration of the objects in terms of , , and . Begin with Newton’s second law applied separately to the two objects.
For the remaining parts, let , , and .
Calculate the magnitude of the acceleration of the objects.
Calculate the tension in the string.
Calculate the speed of the objects after has descended from rest.
An additional mass is now attached to each object, so the masses become and .
Determine whether the magnitude of the acceleration is greater than, less than, or equal to its original value.
Justify the answer using the functional dependence in the expression derived in part (b).
Question 2
The image below shows a crate in contact with a rough horizontal floor. The black arrow defines the positive horizontal direction, and the enlarged region shows the interacting surfaces. The crate has mass , and the coefficients of static and kinetic friction are and , respectively, where . A horizontal applied force in the positive direction is increased slowly from zero.
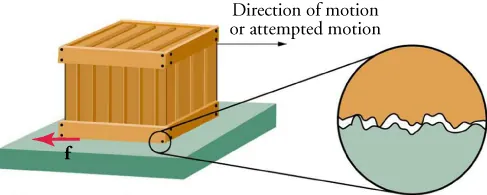
Draw a free-body diagram for the crate while it remains at rest and . The diagram must show and label all forces and represent the appropriate relative magnitudes.
Determine the magnitude and direction of the static friction force while the crate remains at rest.
Justify the answer using the motion of the crate and Newton’s laws.
After the crate begins sliding, derive an expression for its acceleration in terms of , , , and .
Sketch a graph of acceleration on the vertical axis as a function of applied force on the horizontal axis, beginning at and extending to forces greater than . The graph must show the static region, the transition to sliding, and the subsequent kinetic-friction region.
Justify why the acceleration immediately after the crate begins sliding is positive even though its acceleration was zero immediately before sliding began. Refer to both the graph and the friction coefficients.
A second identical crate is secured on top of the first crate. The crates move together as a single system of mass , and the coefficients between the lower crate and the floor remain unchanged.
Sketch a dashed acceleration-versus-applied-force graph for the two-crate system on the axes used in part (d).
Justify the principal differences between the solid and dashed graphs using Newton’s second law and the friction model.
Question 3
The image below shows a mass-and-spring laboratory in which objects can be suspended from vertical springs and their extensions measured. A class constructs a physical version using a spring attached to a support stand, a mass hanger, a set of slotted masses, and a meterstick. The class investigates how the equilibrium extension of the spring depends on the suspended mass.
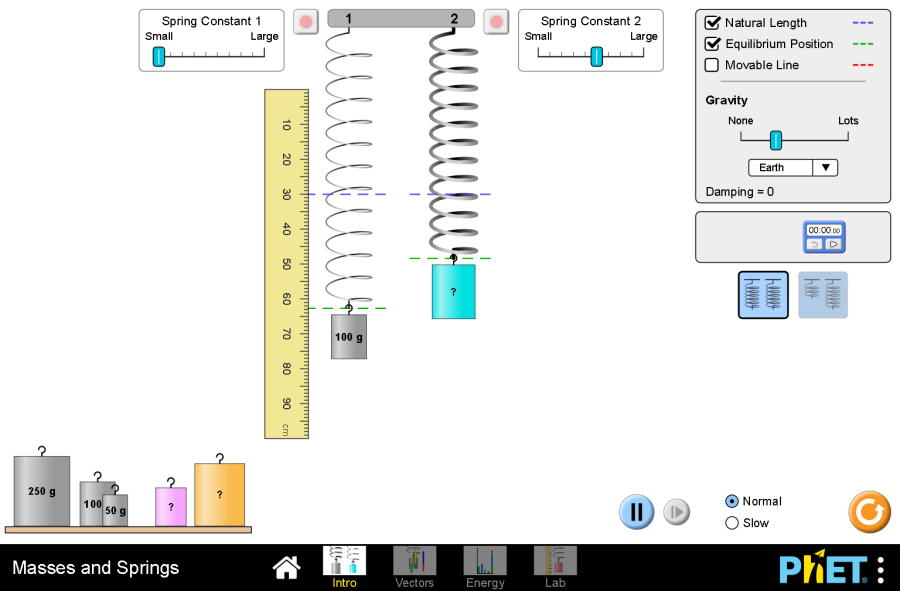
Describe a repeatable experimental procedure for determining the spring constant. The procedure must specify the measurements, how the equilibrium extension is obtained, important control variables, how uncertainty is reduced, and how a graph is used to determine the spring constant.
Indicate the independent variable in the investigation.
Indicate the dependent variable in the investigation.
A different group conducts a similar investigation using the same type of setup. The natural length of the spring is subtracted from every equilibrium-length measurement. Use .
Trial 1: suspended mass ; spring extension .
Trial 2: suspended mass ; spring extension .
Trial 3: suspended mass ; spring extension .
Trial 4: suspended mass ; spring extension .
Trial 5: suspended mass ; spring extension .
Trial 6: suspended mass ; spring extension .
Plot the suspended weight on the vertical axis as a function of spring extension on the horizontal axis. Use labelled axes with units, sensible linear scales, all six data points, and a best-fit line.
Determine the spring constant from the graph.
Calculate the predicted equilibrium extension when the suspended mass is .
Question 4
The diagram below shows a mass attached to a string of length . The mass moves at constant speed in a horizontal circle while the string remains at a constant angle from the vertical. The radius of the circular path is . Air resistance is negligible.
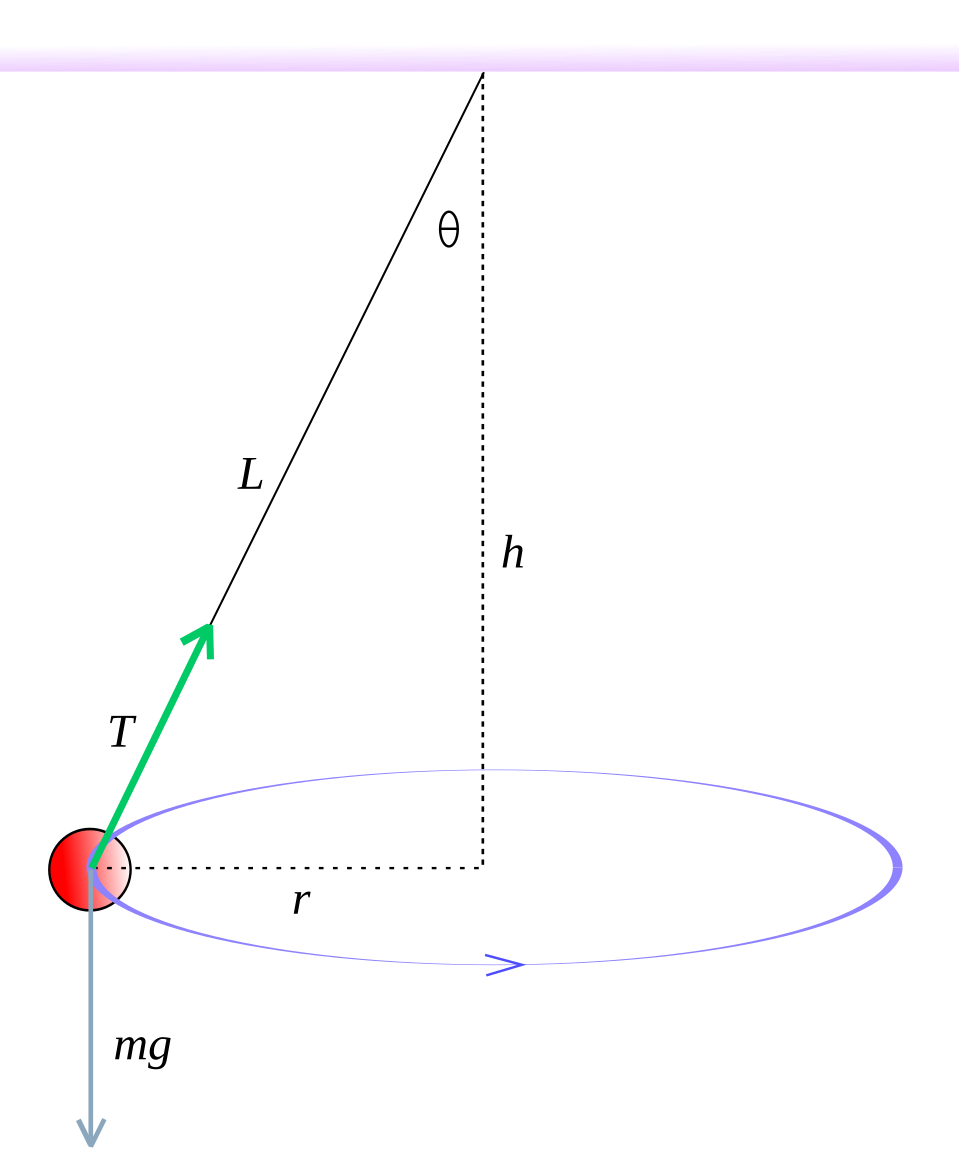
Determine whether the magnitude of the string tension is greater than, less than, or equal to .
Without using equations, Justify the answer by describing the vertical and horizontal effects of the tension force.
Derive an expression for the speed of the mass in terms of , , and . Begin with Newton’s second law in the vertical and horizontal directions.
A second conical pendulum has the same string length and angle but a bob of mass .
Determine whether the period of the second pendulum is greater than, less than, or equal to the period of the original pendulum.
Verify the comparison using the expression from part (c) and the geometry of the circular path.
Question 5
A cart of unknown mass moves along a horizontal track. A student applies a horizontal force while a constant rolling-resistance force acts opposite the cart’s motion. The student measures the cart’s acceleration for several applied forces. The graph below shows the results and a best-fit line.
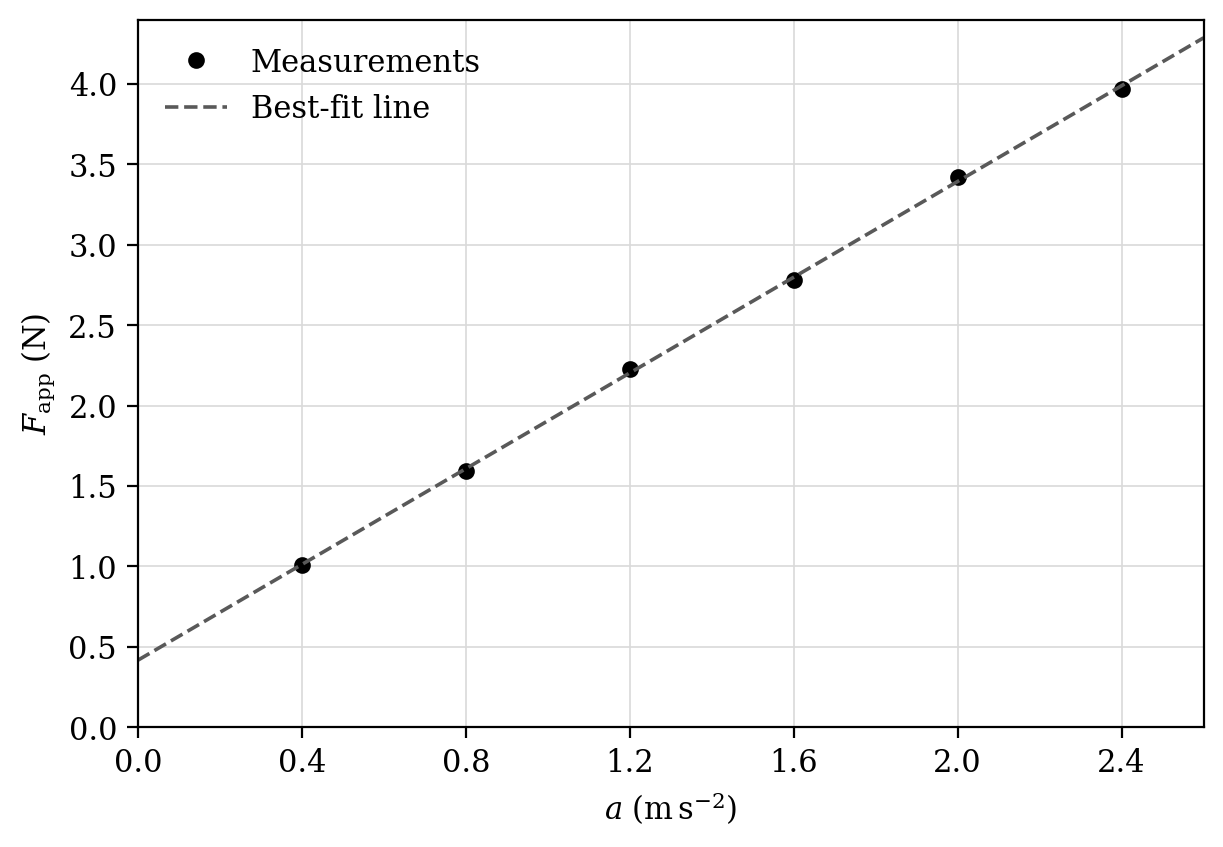
Calculate the slope of the best-fit line. Show the points used and include units.
Derive an expression relating , the cart’s mass , its acceleration , and the magnitude of the rolling-resistance force.
Determine the mass of the cart from the graph.
Determine the magnitude of the rolling-resistance force from the graph.
Calculate the cart’s acceleration when .
Draw a correctly labelled free-body diagram for the cart while it accelerates to the right.
Justify both the nonzero vertical intercept and the physical meaning of the graph’s slope.
Question 6
A block rests on a horizontal surface. A horizontal applied force is increased slowly from zero. The graph shows the magnitude of the friction force exerted on the block. Use .
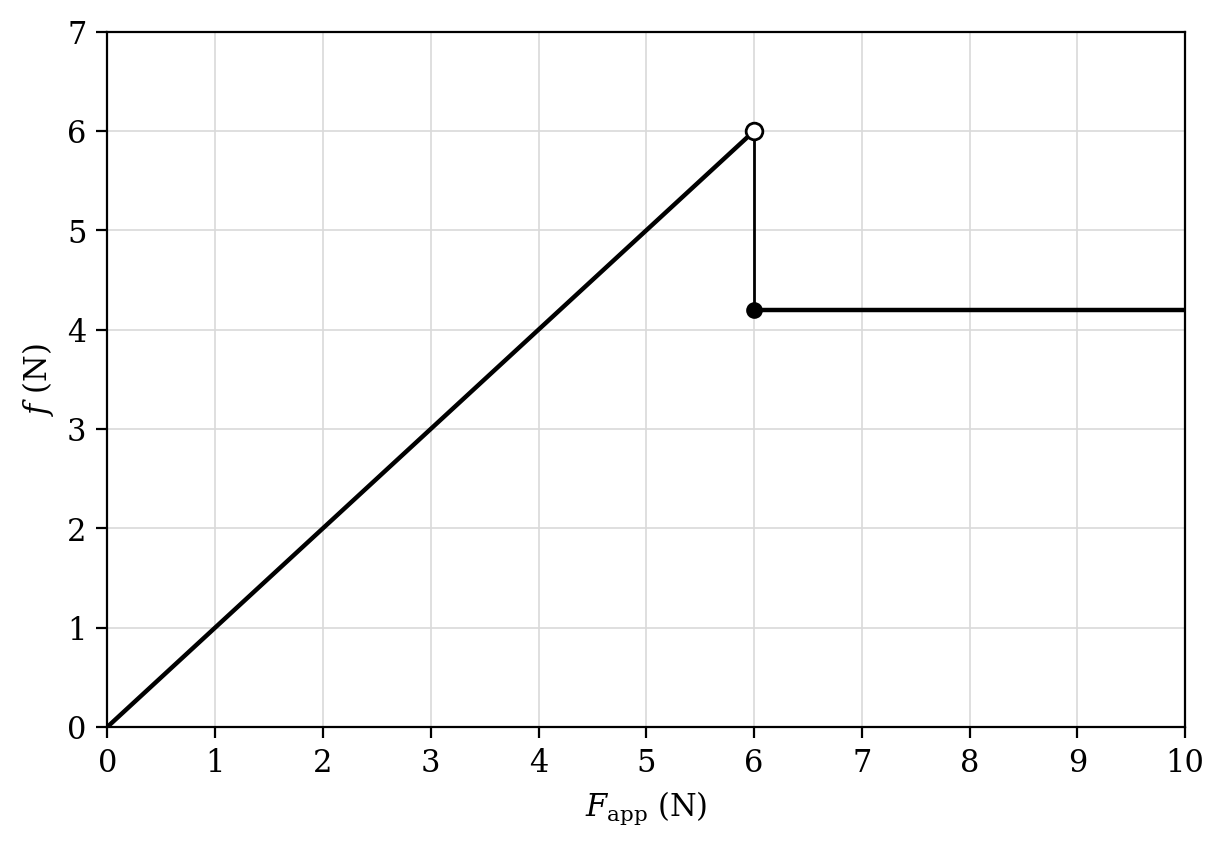
Describe the block’s motion and the type of friction present in each distinct region of the graph.
Draw a free-body diagram for the block when . Indicate the relative magnitudes of the horizontal forces.
Draw a free-body diagram for the block when . Indicate the relative magnitudes of the horizontal forces.
Derive an expression for the block’s acceleration after it begins sliding, in terms of , , and the kinetic-friction magnitude .
Sketch a graph of acceleration as a function of over the interval shown. Include the important transition at the onset of sliding.
Determine the coefficients of static and kinetic friction.
Question 7
A force sensor produces a voltage that depends on the force applied to it. The sensor is calibrated using known forces, producing the graph below. A student will use the sensor to study two springs connected in parallel.
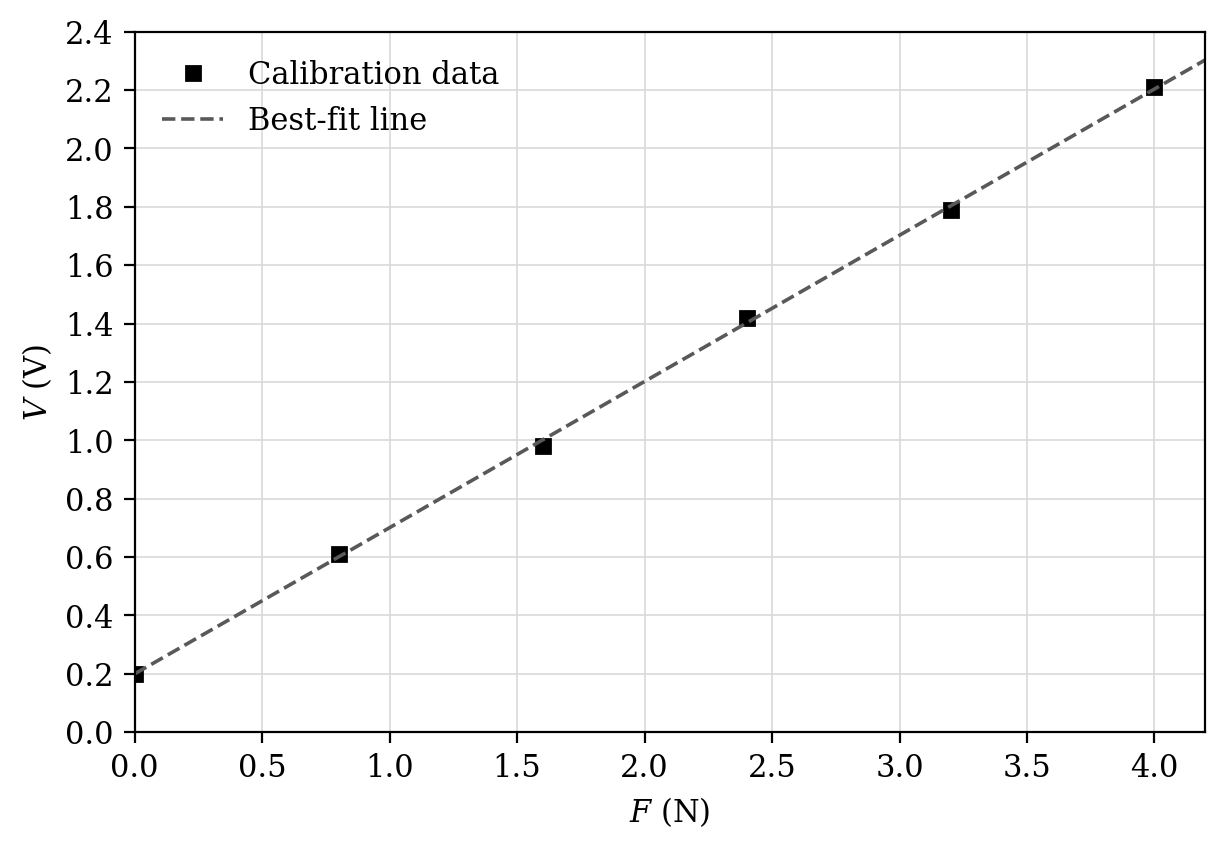
Describe a feasible procedure for determining the equivalent spring constant of the two parallel springs. Include the equipment, the quantity varied, the quantities measured, important controls, and repeated measurements.
Describe how the calibration graph and a graph of the experimental results would be used to determine the equivalent spring constant.
A different pair of parallel springs is tested. The following measurements are obtained.
Trial 1: extension ; sensor output .
Trial 2: extension ; sensor output .
Trial 3: extension ; sensor output .
Trial 4: extension ; sensor output .
Trial 5: extension ; sensor output .
Trial 6: extension ; sensor output .
Calculate the force measured during Trial 4 by using the calibration graph.
Plot the force as a function of extension for all six trials. Label both axes with units and draw a best-fit line.
Determine the equivalent spring constant from the graph created in part (d).
Justify whether the parallel combination behaves approximately as an ideal spring over the measured range.
Question 8
Two spherical objects have masses and . Their centers are separated by a distance . The graph shows the magnitude of the gravitational force between them. Use .
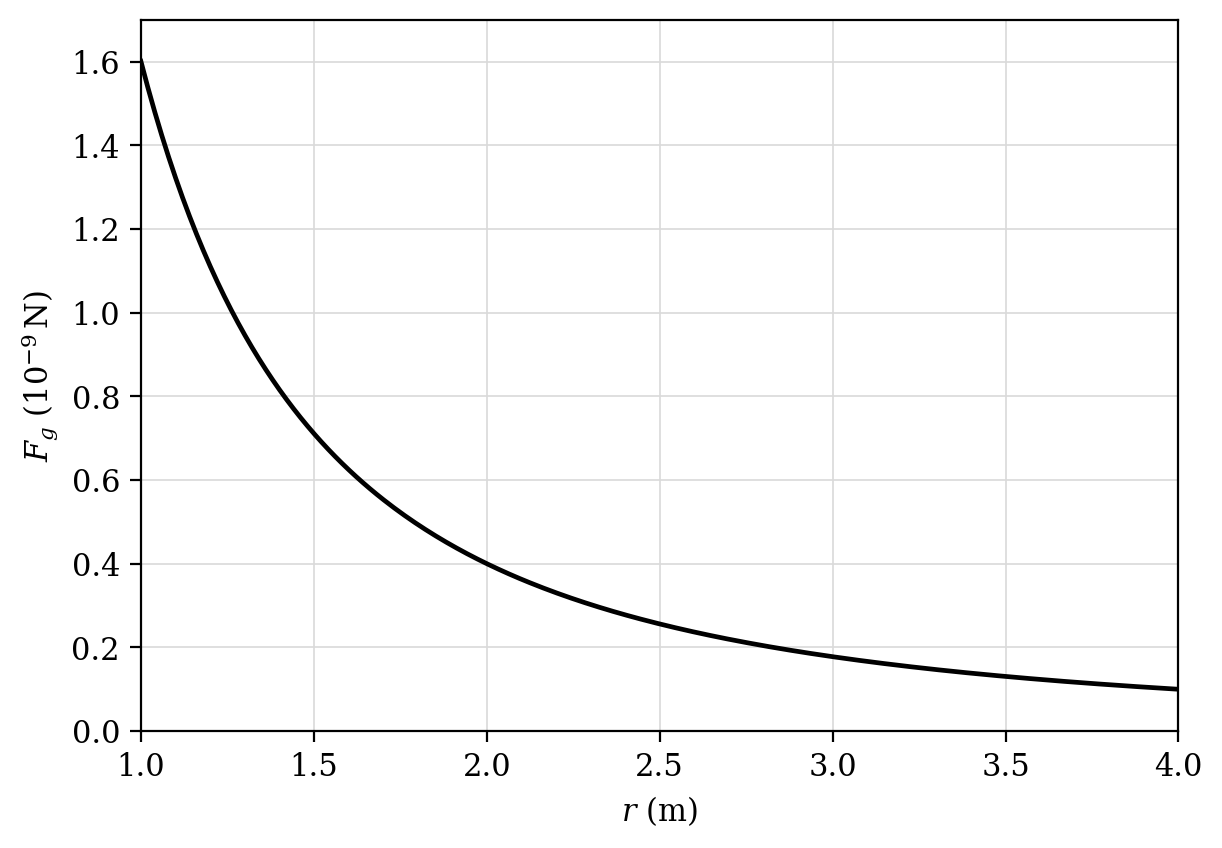
Compare the gravitational-force magnitudes at and .
Justify the comparison in part (a) using the physical model for gravitational interaction, without using equations.
Derive an expression for when the separation changes from to , while the masses remain constant.
Calculate the gravitational-force magnitude at .
Determine the factor by which the force changes if both masses are doubled and the separation is tripled.
Verify that the separation dependence in the answer to part (e) is consistent with the graph’s shape.
Question 9
A cart travels at constant speed in a horizontal circular path. A force sensor measures the total inward force . The student changes the speed while keeping the radius constant and plots against .
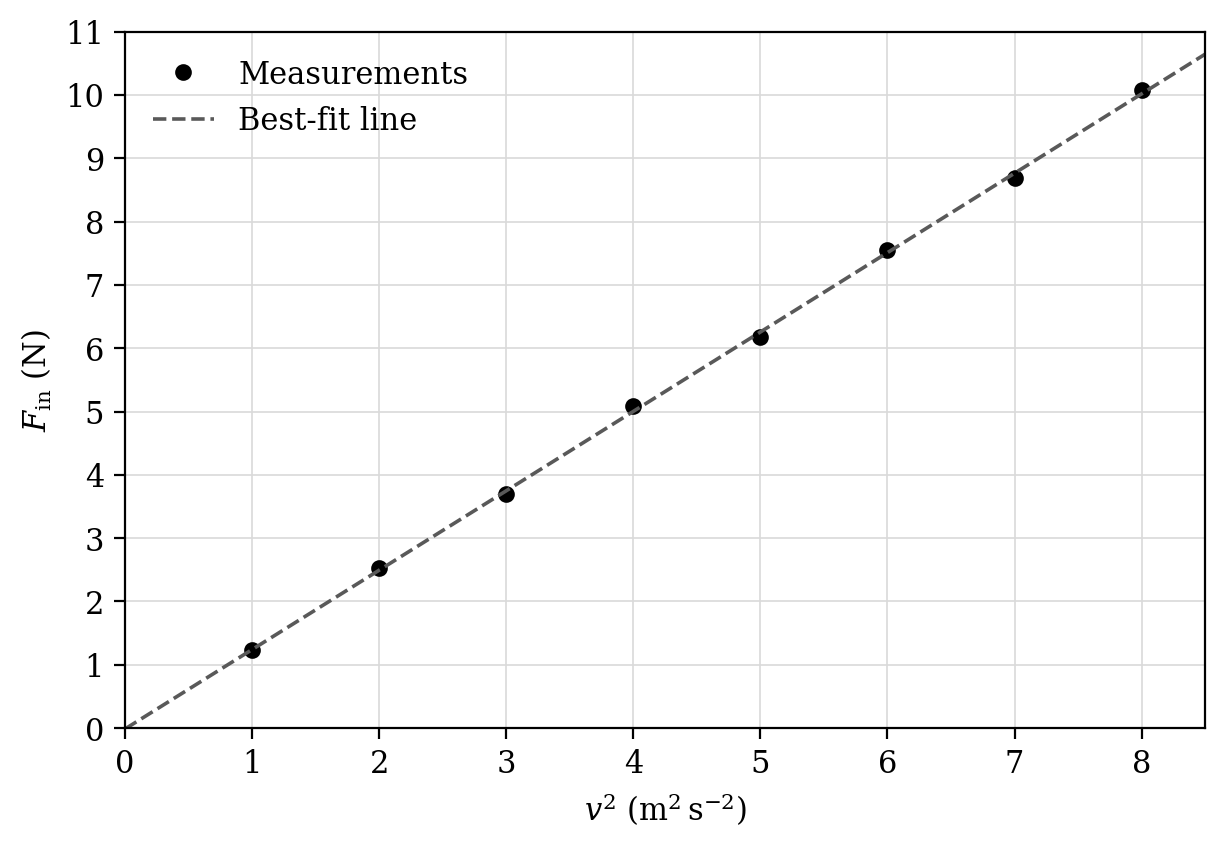
Calculate the slope of the best-fit line, including units.
Derive the relationship between the graph’s slope, the cart’s mass , and the circular-path radius .
Determine the radius of the circular path.
Calculate the cart’s period when .
Draw a top-view free-body diagram for the cart, assuming the string tension is the only horizontal force.
Justify how the required inward force changes when the cart’s speed is doubled while its mass and radius remain constant.
Question 10
A object is released from rest and falls vertically. Downward is defined as positive. In addition to gravity, the object experiences an upward resistive force with magnitude , where is constant. The graph shows the object’s speed. Use .
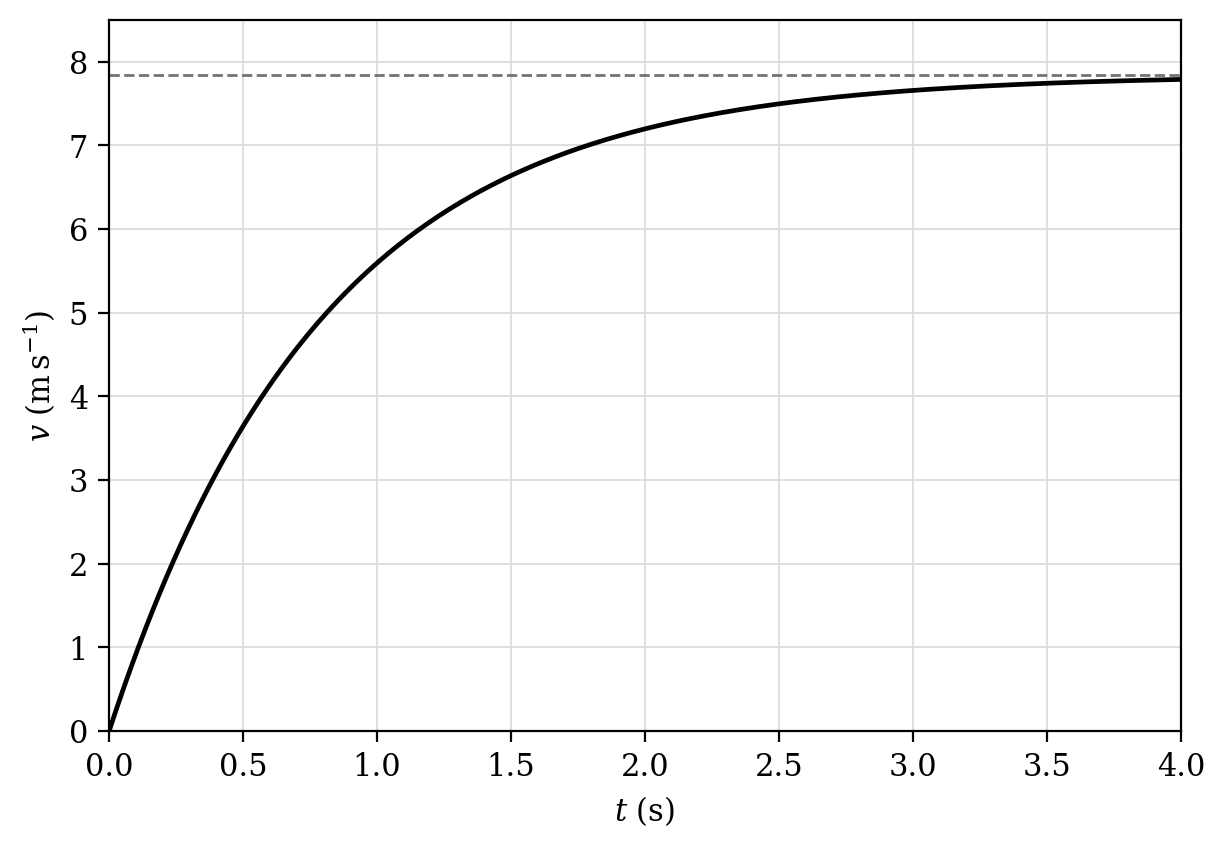
Describe how the magnitudes of the object’s velocity and acceleration change from release until terminal speed is reached.
Draw two free-body diagrams: one shortly after release and one at terminal speed. Show the relative force magnitudes.
Derive an expression for the terminal speed in terms of , , and .
Sketch the object’s acceleration as a function of time. Use downward as positive and show the correct initial and final values.
Sketch the resistive-force magnitude as a function of time.
Determine the value of from the graph.
Determine the terminal speed if the object’s mass is doubled while remains unchanged.
Justify the answer to part (g)(i) using the force condition at terminal speed.