
OCR Specification focus:
‘Identify anomalies in experimental measurements and consider their impact on analysis and conclusions.’
Anomalies threaten data reliability, so spotting unexpected values, judging their causes and deciding their influence is essential for valid biological conclusions in experimental work.
Identifying anomalies
An anomaly is a measurement that does not fit the pattern or trend shown by the rest of the data. It differs markedly from other replicates that were taken under the same controlled conditions. Anomalies weaken confidence in results because they distort calculated values such as means, rates, gradients or percentages, leading to flawed interpretations.
Anomaly: A result that deviates significantly from the expected pattern or trend and is inconsistent with other measurements collected under identical conditions.
Anomalies are first detected by visually inspecting raw data during or immediately after collection. This supports the specification focus on identifying anomalies and considering their impact on analysis and conclusions. When examined early, steps can sometimes be repeated while the apparatus remains set up, improving data quality without altering the investigation.
Recognising anomalies in quantitative data
Students are expected to distinguish clearly between normal variation and genuine anomalies. All biological data contain natural variation, even when variables are controlled effectively. However, certain features indicate that a reading may be anomalous:
A value lies far outside the range of other repeats
A point on a graph breaks the established pattern, relationship or trend
A result contradicts biological expectations based on scientific understanding
A single measurement disproportionately changes a calculated mean
Graphical presentation is a powerful tool.
When plotted, anomalous points typically fall well above or below the line or curve of best fit.
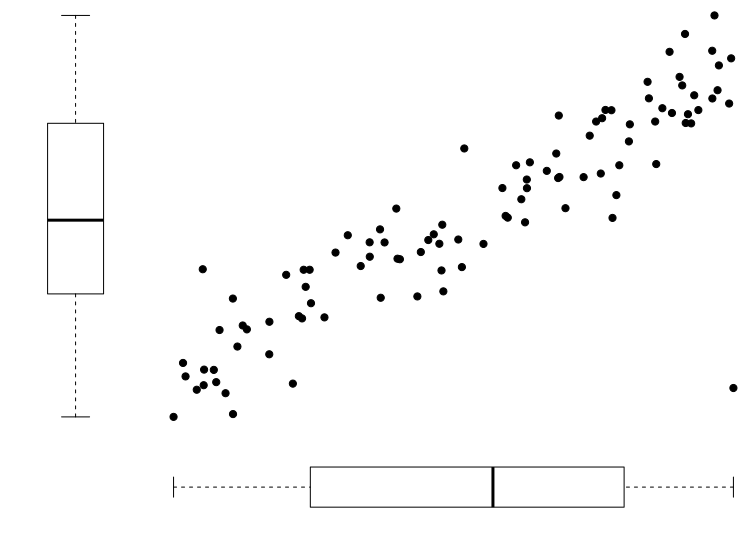
A scatter graph with a single anomalous point that breaks the linear trend, illustrating how anomalies can be visually identified when they fall well outside the expected relationship. Source.
In OCR A-Level Biology, scatter graphs and line graphs are especially useful for identifying measurements that do not align with a correlation. Candidates must then judge whether the point should be included, excluded or repeated.
Judging the impact of anomalies
Anomalies can influence experimental outcomes in several ways. Their impact should be evaluated before moving to analysis or interpretation. Key effects include:
Distortion of averages, making central values unrepresentative
Reduction in precision, increasing data scatter
Altered gradients, affecting calculated rates in biological investigations
Misleading trends, leading to incorrect biological conclusions
If an anomaly significantly changes the outcome, its effect must be acknowledged. The OCR specification requires students to consider their impact on analysis and conclusions, so discussion of anomalies should be explicit when presenting processed data and final statements.
Differentiating anomalies from outliers
Although often used interchangeably, the terms are not identical. An anomaly is identified within the biological context of an experiment, whereas an outlier is a mathematically extreme value. A reading can be an outlier without being anomalous, especially where natural variation is expected. For example, biological samples such as enzyme activity or cell counts often show wide variability. Only when a value is inconsistent with experimental conditions or biological reasoning should it be considered anomalous.
Causes of anomalies
Anomalies typically originate from experimental error, not true biological change. Common causes include:
Measurement error, such as parallax errors when reading scales
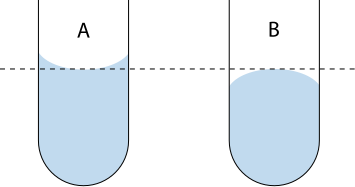
A diagram showing correct eye-level reading of a meniscus, helping prevent parallax error that can lead to anomalous measurements in liquid volume experiments. Source.
Instrument faults, for example an uncalibrated pH meter or balance
Inconsistent technique, including timing errors or varied sample handling
Contamination, such as unintended microorganisms in a culture
Uncontrolled variables, where a factor has drifted without detection
Identifying the likely cause strengthens evaluations and suggests meaningful improvements.
Deciding how to handle anomalies
Once identified, anomalies should not be ignored. OCR expects students to justify their treatment of unusual data by referencing its effect on results. Appropriate responses include:
Repeating the reading when time and resources allow
Excluding the value from calculations if evidence shows it is invalid
Keeping the value visible in a table or graph but marking it clearly
Commenting on its presence when writing processed data and evaluations
At A-Level, values removed from a mean should still be recorded to maintain transparency and good scientific practice.
Supporting anomaly detection with replicates
Replicates are essential for spotting anomalous values because they reveal whether a result is reproducible. If one reading differs greatly from two or more repeats, it is more confidently identified as anomalous. This strengthens reliability and provides evidence-based justification for exclusion or repetition.
Practice Questions
Question 1 (2 marks)
A student records five repeat measurements. One value is much higher than the others and does not follow the pattern.
Name this type of result and state how it could affect the student’s conclusion.
Question 1 (2 marks)
Award 1 mark for:
• Identifying the value as an anomaly or anomalous result
Award 1 mark for any one of:
• It could distort the mean or calculated rate
• It could lead to an incorrect or unreliable conclusion
• It reduces confidence in the pattern or trend
Question 2 (5 marks)
An experiment is carried out to investigate the effect of pH on enzyme activity. One data point on the scatter graph lies far below the line of best fit and does not match the trend.
Explain how the student should identify this anomalous value and discuss how it could influence data analysis and the overall conclusion. Suggest one appropriate action the student could take in response.
Question 2 (5 marks)
Award marks for the following valid points (maximum 5):
• Recognising it as an anomaly because it does not fit the trend or pattern on the graph (1 mark)
• Noting that it lies far from other data or the line of best fit (1 mark)
• Explaining that it could distort the mean, gradient, or rate calculation (1 mark)
• Explaining that it could weaken the reliability of the conclusion or make trends harder to interpret (1 mark)
• Suggesting repeating the measurement, or excluding it with justification, as an appropriate response (1 mark)
FAQ
An anomaly is a value that does not fit the trend and is usually caused by experimental error. A valid extreme value may still be far from other points, but it reflects genuine variation in the biological system.
To decide which it is, students should consider:
• Whether the value matches biological expectations
• Whether conditions were controlled properly during data collection
• Whether repeats support or contradict the value
All recorded measurements must remain visible to ensure transparency and scientific integrity. Hiding them could mislead others about the reliability of the method or data.
Retaining them also allows others to:
• Re-evaluate the decision to exclude
• Judge the strength of the evidence
• Suggest improvements to the practical design
Although there is no fixed number, at least three repeats are normally expected to spot a suspect outlier. With only one or two repeats, it is difficult to judge whether a value is genuinely unreliable or simply part of natural variation.
More repeats:
• Improve confidence in patterns
• Make anomalous values easier to detect
• Increase reliability of calculated means
Yes, but this is less common in controlled A-Level practical work. Sudden changes in biological material, such as uneven cell distribution in a sample or unexpected enzyme degradation, can produce values that break a trend.
Students must still justify whether the value is biologically plausible; if it is, the result may be unusual but not an anomaly.
Referring to anomalies shows critical awareness of data quality. It demonstrates that the student recognises weaknesses and understands their effect on confidence in conclusions.
Effective evaluation may include:
• Stating how an anomaly affected the trend
• Explaining its impact on means, gradients, or reliability
• Suggesting realistic improvements, such as repeating the measurement
