
OCR Specification focus:
‘Discuss precision and accuracy of measurements, margins of error, percentage errors and uncertainties in apparatus.’
Understanding the quality of experimental data is essential in Biology. Reliable measurements support valid conclusions, so students must evaluate precision, accuracy, uncertainty and percentage error when judging the strength of evidence from practical work.
Precision and Accuracy
Biological measurements can differ in how close they are to the true value and how consistent they are. Accuracy refers to how near a result is to the accepted or true value. Precision refers to repeatability, describing how closely grouped repeated measurements are.
Accuracy: The closeness of a measured value to the true or accepted value.
Precise data may still be inaccurate if there is a consistent shift caused by systematic error. In contrast, accurate data may show some spread but still lie close to the true value. Precision is improved by reducing random error, often by repeating measurements and calculating a mean.
Precision: The consistency of repeated measurements, shown by how close they are to each other.
Highly precise results give confidence in repeatability, but improving accuracy requires addressing flaws in equipment, calibration or method. When processing data, OCR expects students to describe whether results are both accurate and precise, using correct scientific terminology.
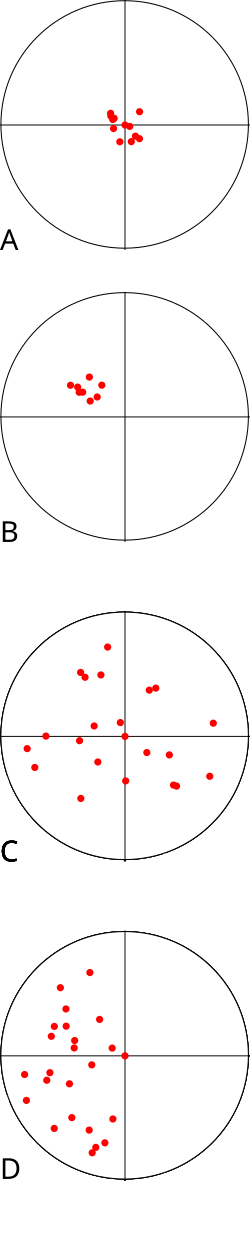
This diagram shows four outcomes: high precision and accuracy, high precision but low accuracy, high accuracy but low precision, and low precision and accuracy. It reinforces correct use of terminology when evaluating practical measurements. Source.
Uncertainty and Sources of Error
All measurements involve uncertainty, because instruments have limits. The uncertainty is the margin within which the true value is expected to lie. For example, a ruler with 1 mm divisions has an uncertainty of ±0.5 mm.
Uncertainty: The interval within which the true value is expected to fall, based on the limits of the measuring instrument.
Random errors cause unpredictable fluctuations, widening data spread, while systematic errors shift all readings in one direction. Students should identify which type of error affects an experiment, because this influences how data should be improved or interpreted. Measuring multiple repeats and considering standard deviation can help judge reliability, but at minimum, uncertainties should be acknowledged.
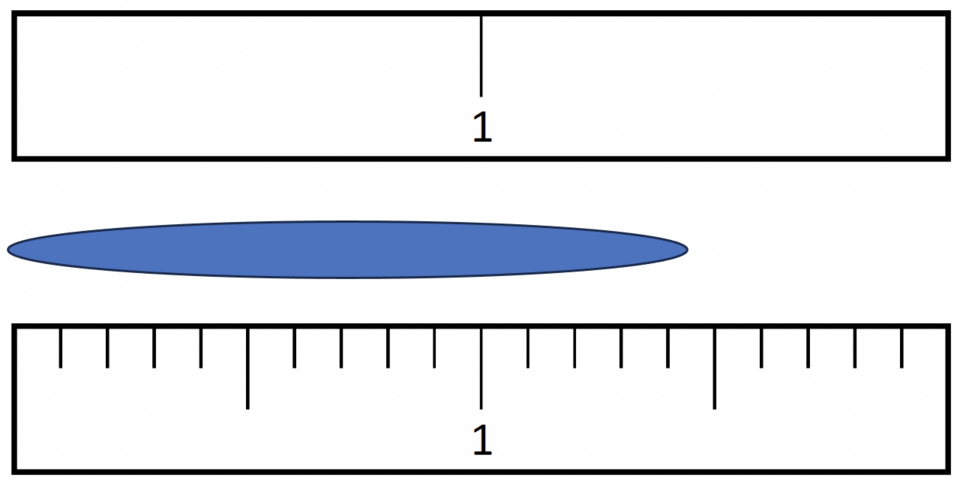
The image shows how different scale divisions alter reading uncertainty and influence the final recorded value. It highlights how finer resolution supports more precise measurement, though it also introduces minor detail about significant figures beyond this subtopic. Source.
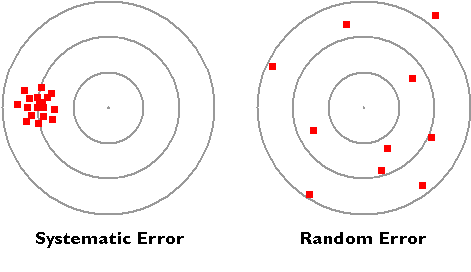
The figure contrasts systematic errors, where all values are biased in one direction, with random errors, where values are scattered unpredictably. It supports understanding of how each affects accuracy and precision. Source.
Percentage Error
Percentage error allows comparison of uncertainty against the size of the measured quantity, helping students judge whether data is sufficiently reliable for conclusions. A small percentage error indicates high confidence in a measurement relative to its size.
EQUATION
—-----------------------------------------------------------------
Percentage Error (%) = (Uncertainty / Measured Value) × 100
Uncertainty = Half the instrument’s range or stated margin (unit varies)
Measured Value = Recorded experimental value (unit varies)
—-----------------------------------------------------------------
This calculation allows direct comparison between different apparatus or experiments because it expresses uncertainty on a common scale. Percentage error is essential when choosing between techniques, evaluating validity, or justifying confidence in results.
Precision and Data Presentation
Clear presentation helps reveal precision and highlight errors. To demonstrate precision:
• Repeat measurements to identify variation
• Plot graphs to visualise spread and trends
• Use means to reduce the influence of anomalies
When readings are tightly grouped, precision is high. If the spread around the mean is large, the method or apparatus may lack sensitivity. Students should comment on this when evaluating data quality in written responses.
Accuracy and Systematic Issues
Accuracy depends on eliminating bias from apparatus and method. To maximise accuracy:
• Calibrate instruments before use
• Ensure correct zeroing
• Avoid parallax error when reading scales
• Choose apparatus with a suitable resolution
Some systematic errors arise from experimental design rather than equipment. For example, heat loss in calorimetry or leakage in gas collection will shift results away from the true value. Identifying such weaknesses is expected in OCR evaluation questions, linking back to the specification requirement to discuss accuracy.
Reducing Uncertainty
Uncertainty can be reduced by:
• Selecting apparatus with a finer scale
• Taking larger measurements to minimise relative uncertainty
• Increasing repeats to improve confidence in the mean
Even when uncertainty cannot be removed completely, acknowledging it demonstrates scientific rigour. OCR expects students to calculate, comment on and, where relevant, compare uncertainties between different methods.
Percentage Error in Evaluation
Percentage error supports judgement of whether results are trustworthy. When discussing validity, students should refer directly to percentage error to justify statements such as:
• “The percentage error is low, so confidence in the result is high”
• “The percentage error is large, reducing reliability”
This links equipment limitations directly to data quality, fulfilling specification requirements.
Precision, Accuracy and Scientific Judgement
Strong evaluation in OCR practical questions requires students to use these terms correctly. Accurate use of precision, accuracy, uncertainty and percentage error demonstrates an ability to assess methods, recognise limitations and judge the strength of evidence.
Practice Questions
Question 1 (2 marks)
A student measures the length of a leaf three times and records values that are very close to one another, but all are noticeably different from the accepted true value.
What do these results show about the precision and accuracy of the measurements?
Question 1 (2 marks)
Award up to 2 marks for:
1 mark: Data is precise because the measurements are closely grouped or repeatable.
1 mark: Data is not accurate because the results are not close to the true or accepted value.
Question 2 (5 marks)
A student uses a thermometer with an uncertainty of ±1 degree Celsius to measure a temperature of 20 degrees Celsius in an experiment.
Explain what is meant by uncertainty, percentage error, and accuracy, and discuss how the student could reduce the effect of uncertainty on the results. Your answer should make direct reference to this investigation.
Question 2 (5 marks)
Award up to 5 marks for:
1 mark: Uncertainty is the margin within which the true value is expected to lie (linked to limits of apparatus).
1 mark: Percentage error is uncertainty expressed as a percentage of the measured value.
1 mark: Accuracy refers to how close a measurement is to the true or accepted value.
1 mark: The thermometer’s ±1 degree Celsius uncertainty contributes to potential inaccuracy or affects confidence in the result.
1 mark: Reduction strategy, such as taking repeated measurements and calculating a mean, or using apparatus with a finer scale to reduce uncertainty or percentage error.
FAQ
Uncertainty is determined by the measuring instrument and reflects the smallest division or stated margin, whereas the range comes from variation in repeated measurements. A dataset can have a small instrument uncertainty but a large range if random error is high.
Range reflects the spread of data between the highest and lowest repeat values, while uncertainty indicates the limit within which the true value is expected to fall, regardless of how many repeats are taken.
Percentage error compares uncertainty to the size of the measurement. When the denominator (measured value) is larger but uncertainty stays the same, the percentage becomes smaller.
This means:
• Measuring a longer distance or larger volume reduces the relative effect of uncertainty
• Percentage error becomes lower, improving confidence in the result
Yes. A measurement may, by chance, fall close to the true value even if the uncertainty of the instrument is large. In this case, accuracy appears high, but confidence in the reliability of the measurement remains low.
Taking repeat readings and calculating a mean helps judge whether the result is genuinely accurate or simply close to the true value by coincidence.
Random errors increase variation between repeats, but their effect can be reduced by averaging, which narrows percentage error. Systematic errors shift results in one direction and can make data inaccurate, but may not change percentage error because the uncertainty of the instrument remains the same.
To reduce systematic error, the procedure or equipment must be corrected or improved, not just repeated.
Because percentage error indicates how much trust can be placed in the measurements behind a conclusion. Even if a trend is visible, a large percentage error weakens the claim that the results genuinely support it.
In evaluation, percentage error provides a quantitative way to justify whether the biological evidence is strong, weak or requires improved methods.
