
OCR Specification focus:
‘Estimate transpiration rate using a potometer; plan, record and interpret data, handling uncertainties and variables appropriately.’
Transpiration is the loss of water vapour from plant surfaces, mainly through stomata. Measuring transpiration helps reveal plant water balance and environmental influences on water loss.
Principles of Measuring Transpiration
Transpiration is driven by water potential gradients from the moist internal leaf air spaces to the drier external atmosphere. It occurs primarily via stomata on leaf surfaces. The rate of transpiration can be inferred by measuring water uptake, assuming that water loss and uptake are nearly equivalent under steady conditions.
Plants lose water because water potential (ψ) in the leaf is higher than in the surrounding air. Water vapour moves down this gradient, and this loss must be replaced by water drawn up through the xylem from the roots.
Equipment and Apparatus: The Potometer
A potometer is an apparatus used to measure the rate of water uptake by a cut plant shoot. It does not directly measure transpiration rate, but provides a reliable proxy under controlled conditions.
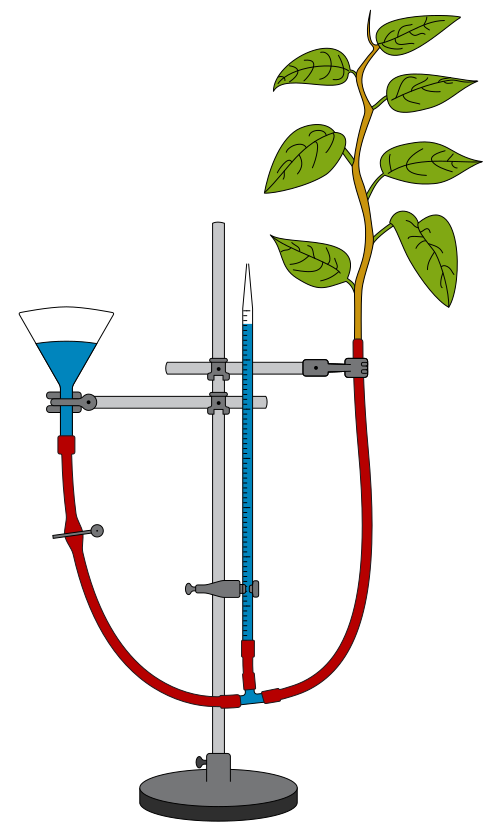
Labeled diagram of a bubble potometer showing the capillary tube, reservoir, and shoot connection with seals. Students use the scale on the capillary to measure bubble displacement over time as a proxy for transpiration rate. The simple layout highlights where airtight seals are critical to avoid leaks. Source.
There are two main types:
Simple (bubble) potometer – measures the rate of air bubble movement along a capillary tube.
Mass potometer – records mass loss over time from a sealed system.
Essential components of a bubble potometer:
Capillary tube with a graduated scale.
Water reservoir to reset the bubble position.
Airtight connections to prevent leakage.
A leafy shoot inserted through a rubber bung.
Setting Up the Potometer
To ensure accuracy and reliability:
Cut the shoot underwater – prevents air entering xylem vessels, avoiding air embolism (air bubbles that block water transport).
Ensure airtight seals – wrap junctions with waterproof grease or use tight-fitting rubber tubing.
Allow the plant to acclimatise – maintains natural transpiration rate before measurement begins.
Introduce an air bubble – gently move the reservoir to bring the bubble into the capillary tube.
Record bubble movement – measure the distance moved over a set time period using a stopwatch.
Air embolism: A blockage in xylem vessels caused by trapped air, preventing normal water movement.
Each movement of the bubble represents a known volume of water absorbed by the shoot. By recording this distance and the time, the rate of water uptake can be calculated.
EQUATION
—-----------------------------------------------------------------
Rate of water uptake (mm³ s⁻¹) = Volume of water absorbed / Time taken
Volume of water absorbed = Cross-sectional area of capillary × Distance moved by bubble
—-----------------------------------------------------------------
One must remember that water uptake ≠ water loss exactly, because some water is used in photosynthesis or stored in tissues. However, over short time intervals, the difference is minimal.
Variables Affecting Transpiration Rate
Transpiration is influenced by both internal and external factors. During practical investigations, it is essential to control or record these variables to obtain valid data.
Environmental factors:
Light intensity: Increases stomatal opening, enhancing transpiration.
Temperature: Warmer air raises evaporation rate and diffusion speed.
Humidity: High humidity lowers the water potential gradient, reducing transpiration.
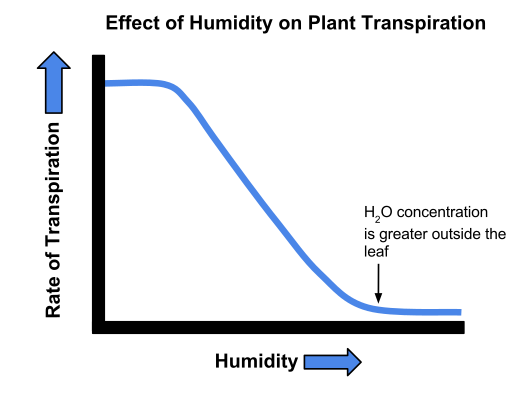
Graph depicting transpiration rate versus relative humidity, illustrating reduced water loss as ambient humidity rises. This visual helps students link environmental control to observed changes in potometer readings. The diagram includes only the relationship required by the syllabus; no extra mechanisms are shown. Source.
Air movement: Wind removes moist air from around leaves, steepening the gradient.
Water availability: Drought or closed stomata reduce water loss and uptake.
Internal factors:
Leaf surface area: Larger area provides more stomata for gas exchange.
Cuticle thickness: A thicker cuticle decreases evaporation.
Stomatal density and distribution: More stomata lead to greater potential water loss.
In a laboratory investigation, it is vital to alter only one variable at a time while keeping others constant, ensuring that results are due to the independent variable alone.
Recording and Interpreting Data
Data should be recorded in a clear table showing:
Time intervals (minutes or seconds)
Bubble position or volume of water absorbed
Environmental conditions (light level, temperature, etc.)
Graphical representation of the data allows for the visual analysis of trends — for example, plotting volume of water absorbed (y-axis) against time (x-axis) to determine rate. The gradient of the line gives the rate of uptake.
Rate of transpiration: The volume of water lost by a plant per unit time, usually expressed as mm³ s⁻¹ or cm³ h⁻¹.
When interpreting data:
A steeper slope indicates faster transpiration.
Plateaus may suggest closure of stomata or reduced driving gradients.
Unexpected fluctuations should be checked against environmental changes or apparatus leaks.
Handling Uncertainties and Errors
To ensure accuracy and reliability, biological investigations require careful handling of uncertainties.
Sources of uncertainty:
Small leaks in the system allowing unnoticed water loss.
Air bubbles not forming uniformly.
Inaccurate timing or reading of scale.
Variability in leaf size or stomatal distribution.
Reducing uncertainty:
Repeat measurements and calculate a mean rate.
Calibrate apparatus using a control setup.
Maintain constant temperature and humidity with controlled environment chambers.
Ensure all seals are watertight and consistent.
When presenting data, it is good practice to include units, error bars on graphs, and to calculate percentage error to reflect measurement precision.
EQUATION
—-----------------------------------------------------------------
Percentage error (%) = (Absolute uncertainty / Measured value) × 100
Absolute uncertainty = ± smallest scale division or estimated measurement error
—-----------------------------------------------------------------
Accurate planning also requires identifying dependent and independent variables, and controlling confounding factors.
Experimental Design and Evaluation
A well-designed potometer experiment should include:
Clear hypothesis — e.g., increasing light intensity raises transpiration rate.
Control variables — temperature, humidity, wind speed, and shoot characteristics.
Multiple replicates — enhances statistical reliability.
Accurate timing and distance measurement — ensures reproducibility.
Evaluation involves comparing measured results with theoretical expectations. For instance, higher rates in lighted versus dark conditions confirm stomatal response to light. Discrepancies can be discussed in relation to stomatal behaviour, leaf turgidity, or apparatus precision.
Finally, understanding transpiration’s role in water transport links this investigation to broader plant physiology — maintaining turgor, enabling nutrient transport, and contributing to temperature regulation through evaporative cooling.
Practice Questions
Question 1 (2 marks)
A student uses a bubble potometer to estimate the rate of transpiration in a plant shoot.
Explain why the shoot must be cut underwater when setting up the potometer.
Mark scheme:
1 mark: Cutting underwater prevents air from entering the xylem vessels.
1 mark: This avoids air embolisms that would block water transport and disrupt uptake measurements.
Question 2 (5 marks)
A student investigates how air movement affects transpiration rate using a bubble potometer.
They place a fan near the plant shoot and record the distance the air bubble moves in a set time.
Explain how the student should ensure valid results and describe how air movement influences the rate of transpiration.
Mark scheme:
1 mark: Only the air movement should be changed; all other variables (light intensity, temperature, humidity) kept constant.
1 mark: The apparatus must be airtight to prevent leaks affecting measurements.
1 mark: The rate should be calculated by measuring distance moved by the bubble over a fixed time period.
1 mark: Air movement removes humid air from around the leaves, increasing the water potential gradient.
1 mark: This increases the rate of diffusion of water vapour from the leaf, so the transpiration rate rises.
FAQ
A potometer indirectly measures transpiration by recording water uptake. The assumption is that most water absorbed by the shoot is lost through transpiration, with only a small proportion used in photosynthesis or retained for cell turgor.
Directly measuring water vapour loss would require complex apparatus to capture and quantify the vapour itself. Hence, the potometer offers a practical proxy for comparing relative transpiration rates under controlled conditions.
To improve accuracy:
Use a closed chamber or environmental cabinet to stabilise temperature, humidity, and airflow.
Record environmental parameters using sensors to detect fluctuations.
Perform repeated trials and calculate mean values to minimise random error.
If conditions vary, measurements should be taken quickly and consistently to reduce the effect of changing external factors.
Several physiological factors can limit transpiration:
Stomatal closure due to low leaf water potential or hormonal signals (abscisic acid).
Leaf wilting, which reduces surface area exposed to air.
Xylem cavitation, where air bubbles disrupt continuous water flow.
These internal adjustments allow the plant to conserve water and prevent damage from excessive water loss.
Safety measures ensure both personal safety and experiment integrity:
Cut shoots with care using a sharp scalpel or razor underwater to prevent injury and air embolisms.
Avoid handling fragile glass capillary tubes roughly to prevent breakage.
If using water baths or lights, monitor for electrical safety and overheating.
Clean up spilled water promptly to prevent slipping and maintain accurate readings.
This usually indicates a fault in the setup. Possible reasons include:
Leaks allowing air or water to escape from joints.
Temperature changes causing water expansion or contraction in the capillary.
Blocked xylem or air embolisms disrupting continuous flow.
Condensation forming inside the apparatus.
Careful checking of seals, stable temperature, and freshly cut shoots usually resolve these issues and restore consistent bubble movement.
