
OCR Specification focus:
‘Measure biodiversity within a habitat by assessing species richness and species evenness using appropriate quantitative methods.’
Biodiversity within a habitat depends on both the number of species present and how evenly individuals are distributed among them, giving insight into ecological balance and stability.
Understanding Biodiversity Within a Habitat
Biodiversity reflects the variety of living organisms in a particular ecosystem. When studying biodiversity, ecologists assess not only what species are present but also how they coexist. This helps reveal whether a habitat is dominated by a few species or supports a diverse and balanced community. Two key quantitative measures underpin this assessment: species richness and species evenness. Together, these give a more complete understanding of the biological complexity of a habitat.
Species Richness
Species richness refers to the number of different species present in a particular area or community. It is a simple count of how many distinct species exist, without considering how abundant each one is.
Species Richness: The number of different species present in a defined area or habitat.
Species richness provides a basic measure of biodiversity, but on its own, it can be misleading. A habitat might have high species richness but still be dominated by one or two species. Therefore, richness must always be interpreted alongside species evenness to understand biodiversity more accurately.
Assessing Species Richness
Field ecologists use various sampling methods to identify species within a habitat. These can include:
Quadrats for plants and slow-moving organisms.
Sweep nets for flying insects.
Pitfall traps for ground-dwelling invertebrates.
Pooters for small insects.
After identifying and counting each species, richness can be determined by simply tallying the total number of species recorded. However, because species distribution may vary across the habitat, representative sampling and random placement of quadrats or traps are essential to obtain reliable data.
Species Evenness
Species evenness describes how similar the abundances of different species are in a community. It measures the relative proportion of individuals within each species.
Species Evenness: A measure of how evenly individuals are distributed among the species in a community.
If all species in a habitat are equally abundant, evenness is high; if one species dominates while others are rare, evenness is low. High evenness indicates a balanced ecosystem, whereas low evenness suggests potential ecological stress or disturbance.
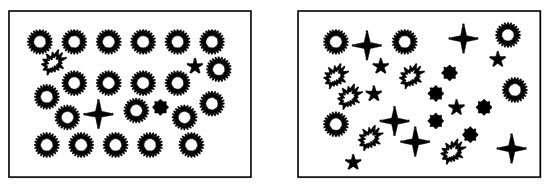
Two communities each contain the same number of “species” (identical richness) but differ in how individuals are distributed across species (evenness). The right-hand community shows higher evenness because abundances are similar across species. This directly illustrates why evenness must be considered alongside richness when measuring biodiversity within a habitat. Source
Assessing Species Evenness
To assess evenness, ecologists count the number of individuals of each species from their samples. These counts are often converted into proportions or percentages to show the relative representation of each species.
Key steps include:
Determining the total number of individuals of all species combined.
Calculating the proportion each species contributes to the total.
Comparing proportions to identify dominance or balance.
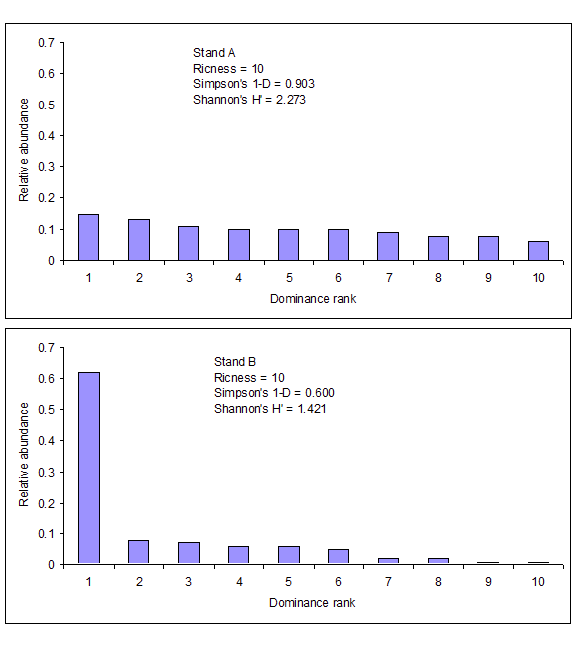
Bar plots for two communities with identical species counts (richness) show that Stand A has more uniform relative abundances (higher evenness) than Stand B, which is dominated by a single species. This visual reinforces how evenness modifies our interpretation of diversity beyond a simple species tally. Note: the small labels for Simpson’s 1–D and Shannon’s H′ appear in the figure; those indices are beyond this sub-subtopic but do not affect the message about richness vs evenness. Source
In practical terms, evenness gives insight into how well resources are shared among species and whether competition is affecting certain populations.
Quantitative Methods in Measuring Biodiversity
Biodiversity measurement combines richness and evenness data to provide a numerical estimate of diversity. While richness shows the range of species, evenness adds depth by showing how those species coexist. Together, they can be used in various quantitative methods—notably those that underpin indices such as Simpson’s Index of Diversity (D), though that specific calculation is covered separately.
The Importance of Quantitative Assessment
Quantitative assessment allows ecologists to:
Compare different habitats objectively.
Monitor changes in biodiversity over time.
Evaluate conservation efforts by tracking diversity before and after intervention.
Detect ecological imbalance, such as overdominance of invasive species or decline in sensitive populations.
These methods transform biodiversity from a qualitative observation into a scientifically measurable concept, supporting evidence-based conservation and management.
Relationship Between Species Richness and Evenness
Both richness and evenness are interdependent measures that together define the overall biodiversity of a habitat. A balanced ecosystem tends to have:
High species richness, meaning many species coexist.
High species evenness, meaning species exist in similar proportions.
However, different ecological scenarios demonstrate how these factors interact:
A species-rich but uneven habitat (e.g., tropical forest dominated by one tree species) may still face instability.
A species-poor but even habitat (e.g., an Arctic tundra) can still maintain ecological balance despite low diversity.
In biodiversity analysis, therefore, the combination of richness and evenness is more meaningful than either alone.
Ecological Significance of Richness and Evenness
Ecosystem Stability
Habitats with high richness and evenness are generally more resilient to environmental changes. The presence of many species performing different roles ensures functional redundancy—if one species declines, others can fulfil similar ecological functions.
Resource Distribution
Evenness reflects how efficiently resources such as food, space, and light are shared among organisms. High evenness suggests that competition is balanced and resources are equitably utilised, supporting long-term ecosystem health.
Indicator of Environmental Stress
Low evenness often signals disturbance or pollution, as a few tolerant species may dominate. Therefore, evenness acts as an indicator of habitat condition and can highlight areas requiring conservation intervention.
Conservation and Management Applications
By assessing species richness and evenness, conservationists can:
Identify biodiversity hotspots for protection.
Evaluate success of restoration projects by tracking increases in evenness.
Detect invasive species impacts, where dominance reduces evenness.
Inform habitat management plans based on quantitative biodiversity data.
Integrating Sampling and Data Analysis
Reliable biodiversity assessment depends on robust sampling and careful data handling. Ecologists must:
Use standardised methods across sites to ensure comparability.
Conduct repeated sampling to reduce random error.
Apply statistical tests to confirm whether observed differences are significant.
This process turns field observations into quantitative evidence that can be used for ecological research, environmental policy, and conservation planning.
In summary, species richness and evenness form the dual foundation for measuring biodiversity within a habitat. Together, they provide essential insight into ecological balance, health, and sustainability through structured, quantitative study methods.
Practice Questions
Question 1 (2 marks)
Define the terms species richness and species evenness as measures of biodiversity within a habitat.
Mark scheme:
1 mark: Species richness – number of different species present in a defined area or habitat.
1 mark: Species evenness – how similar the population sizes or abundances of different species are within a community.
Question 2 (5 marks)
An ecologist surveys two woodland areas. Both areas contain ten species of plants, but in Area A, each species has a similar number of individuals, whereas in Area B, one species is very abundant and the others are rare.
Explain how the biodiversity of the two areas compares and how species richness and evenness contribute to this comparison.
Mark scheme:
1 mark: Both areas have the same species richness because each has ten species.
1 mark: Area A has higher species evenness because individuals are more evenly distributed among species.
1 mark: Area B has low evenness because one species dominates the community.
1 mark: Higher evenness in Area A indicates greater overall biodiversity despite equal richness.
1 mark: Area A’s balanced distribution suggests a more stable and resilient ecosystem compared to Area B.
FAQ
Ecologists determine sample size by ensuring that enough of the habitat is sampled to capture the full range of species present. This often involves using a species accumulation curve, which plots the cumulative number of species found against the number of samples taken.
Sampling continues until the curve begins to level off, indicating that additional samples are unlikely to reveal new species.
Factors influencing sample size include habitat size, species mobility, and environmental heterogeneity — more complex or variable habitats generally require larger sample sizes.
Species richness simply counts how many species are present, without considering how abundant each one is.
A habitat may have many species (high richness) but be dominated by one or two, leading to low species evenness. This means resources are unevenly shared and ecosystem stability may be reduced.
Therefore, ecologists always combine richness with evenness measures or use diversity indices (such as Simpson’s Index) to give a more meaningful assessment of biodiversity.
Several factors can decrease evenness by allowing one or a few species to dominate:
Pollution or nutrient enrichment, which favours tolerant species.
Habitat disturbance such as deforestation or urbanisation, which removes sensitive species.
Invasive species, which outcompete native ones for resources.
Extreme environmental conditions, limiting the range of species that can survive.
A fall in evenness often indicates ecological stress or imbalance, making it a useful measure for conservation monitoring.
When conservation measures are effective, rare or suppressed species begin to recover, and dominance by a few species decreases.
Indicators of improving evenness include:
A more uniform distribution of individuals across species.
Reduction in dominance index values.
Increased presence of previously absent or endangered species.
By tracking evenness over time, ecologists can assess whether an ecosystem is returning to a balanced, self-sustaining state.
Yes, they can vary independently. Species richness may remain constant while evenness changes, or vice versa.
For example:
After an invasive species arrives, richness might stay the same but evenness falls because the invader dominates.
Following mild environmental recovery, evenness might improve as populations rebalance, even if no new species appear.
This independence is why both measures are essential for accurate biodiversity assessment. Each provides unique insight into habitat structure and ecological dynamics.
