
OCR Specification focus:
‘Use and interpret Simpson’s Index of Diversity (D) to quantify biodiversity; know implications of high and low D values; formula provided when assessed.’
Simpson’s Index of Diversity (D) is a quantitative measure used to describe biodiversity within a habitat, considering both the number of species present and their relative abundance.
Understanding Biodiversity Measurement
Biodiversity within a habitat can be measured not only by identifying the number of species (species richness) but also by evaluating how evenly individuals are distributed among those species (species evenness). Simpson’s Index of Diversity provides a single numerical value summarising these two components, offering insight into the ecological stability and resilience of a community.
Importance of Quantifying Biodiversity
Quantifying biodiversity allows ecologists to:
Compare different habitats or monitor changes over time.
Assess the impact of human activity or conservation efforts.
Provide data to inform management decisions and biodiversity protection strategies.
Simpson’s Index of Diversity Explained
Simpson’s Index of Diversity (D) reflects the probability that two individuals randomly selected from a sample belong to different species. It is derived from Simpson’s Index (Simpson’s Index of Dominance), which calculates the probability that two individuals are of the same species. The diversity index, therefore, inverts the dominance measure to highlight variety rather than similarity.
EQUATION
—-----------------------------------------------------------------
Simpson’s Index of Diversity (D) = 1 – (Σ(n/N)²)
n = Number of individuals of a particular species
N = Total number of all individuals of all species
—-----------------------------------------------------------------
In this formula, Σ(n/N)² represents the sum of the squared proportional abundances of each species within the habitat. By subtracting this from one, the value of D gives an intuitive representation of biodiversity: the higher the value, the more diverse the community.
After the equation is applied, results typically range between 0 and 1. A value close to 0 indicates low diversity (dominated by a few species), whereas a value close to 1 indicates high diversity (many species with balanced populations).
Understanding Each Component
Species Richness
Species richness is the total number of different species found within a defined area. High richness means more species are present. However, richness alone does not convey how evenly individuals are spread among those species.
Species Evenness
Species evenness reflects the relative abundance of each species. When all species have similar population sizes, evenness is high, leading to a higher D value. When one or few species dominate, evenness decreases, lowering D.
The Relationship Between Richness and Evenness
Simpson’s Index incorporates both aspects to avoid misleading interpretations. For instance, a habitat with many species but one overwhelmingly dominant species might appear diverse by richness alone but would have a low D value due to low evenness.
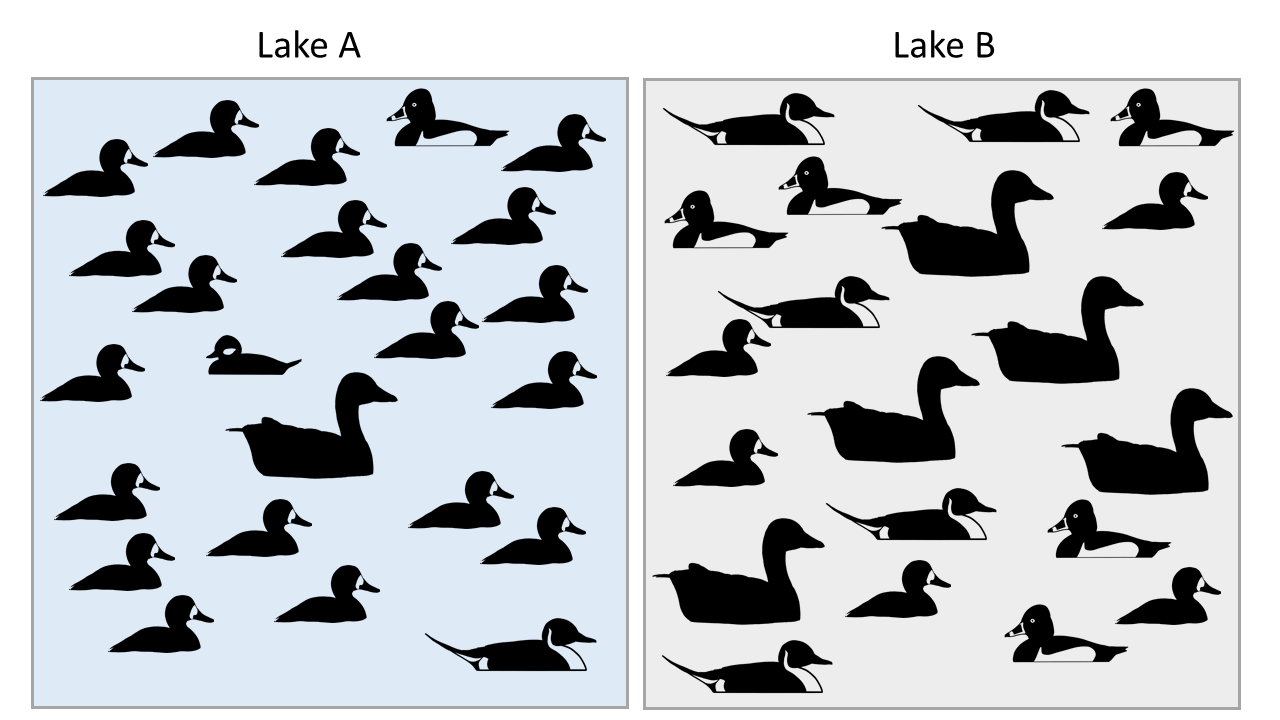
Two communities (Lake A and Lake B) have the same number of species and total individuals, but Lake B shows greater evenness. Because Simpson’s Index weights abundant species, the less even community yields a higher D (lower diversity), while the more even community yields a lower D (higher diversity) when expressed as 1 − D. This directly illustrates why evenness matters as much as richness. Source.
Interpretation of High and Low D Values
Understanding what high and low values signify is critical for ecological assessment and conservation.
High D Value – Greater Biodiversity
Indicates many species with relatively balanced abundances.
Suggests a stable ecosystem with greater resilience to environmental change or disturbance.
Common in habitats like tropical rainforests, meadows, and coral reefs.
High biodiversity often corresponds to numerous ecological niches and complex food webs.
Low D Value – Reduced Biodiversity
Suggests few species dominate the habitat.
May indicate pollution, habitat destruction, or human interference such as agriculture or urbanisation.
Ecosystems with low diversity tend to be less stable and more vulnerable to environmental stress or disease.
Often observed in monocultures or heavily managed agricultural systems.
Applications of Simpson’s Index
Simpson’s Index is a versatile tool widely used in ecological research and conservation management:
Monitoring Environmental Change: Repeated sampling over time helps identify biodiversity loss or recovery trends in response to conservation or disturbance.
Comparing Habitats: By comparing D values, ecologists can determine which habitats support greater diversity or identify areas needing protection.
Assessing Human Impact: Industrial development, pollution, or deforestation can be quantitatively linked to declining D values, providing scientific evidence for policy decisions.
Supporting Conservation Planning: Biodiversity indices like Simpson’s help prioritise conservation efforts, identify biodiversity hotspots, and evaluate the success of management strategies.
Practical Considerations in Using Simpson’s Index
Sampling Accuracy
Accurate calculation of D depends on representative sampling of the habitat. Both random and systematic sampling methods are used to ensure that results reflect the true diversity rather than sampling bias.
Sample Size and Effort
Larger samples yield more reliable estimates of biodiversity.
Inadequate sample sizes may fail to capture rarer species, leading to underestimation of D.
Consistent sampling methodology allows fair comparison between sites.
Limitations of the Index
While powerful, Simpson’s Index has certain constraints:
It may underrepresent rare species since the formula emphasises abundant species through squaring proportions.
It assumes random sampling and may be influenced by uneven effort or habitat heterogeneity.
It provides a single value, which, while convenient, can obscure complex ecological relationships.
Nevertheless, when used alongside other indices and qualitative observations, Simpson’s Index remains an essential measure of ecological diversity.
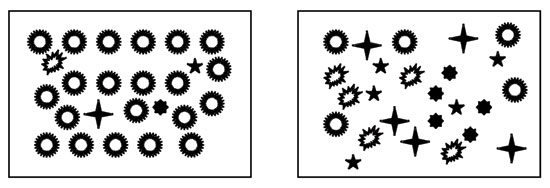
Both panels show equal richness, but the right-hand panel has higher evenness (species are closer in abundance). Simpson’s D (or 1 − D) is sensitive to this pattern: higher evenness produces a lower D (and therefore a higher 1 − D) because the probability of drawing two individuals of the same species declines. This schematic focuses only on richness and evenness, the two ingredients of Simpson’s Index. Source.
Ecological and Conservation Implications
Simpson’s Index provides insight into ecosystem health, stability, and productivity. High D values imply resilience and genetic variety, essential for adaptation to environmental change. Conversely, low D values signal potential degradation, guiding conservationists to intervene.
Conservationists use D to prioritise ecosystems requiring protection and to evaluate outcomes of initiatives such as habitat restoration, pollution control, and reforestation programmes. This metric thus bridges field data and conservation policy, reinforcing the ecological necessity of maintaining biodiversity across all scales.
Practice Questions
Question 1 (2 marks)
Explain the difference between species richness and species evenness in the context of biodiversity measurement.
Mark scheme:
1 mark for correctly defining species richness as the number of different species present in a habitat.
1 mark for correctly defining species evenness as the relative abundance of individuals across those species (how evenly individuals are distributed among species).
Question 2 (5 marks)
A conservation biologist calculates Simpson’s Index of Diversity (D) for two woodland areas.
Woodland A has a D value of 0.78, and Woodland B has a D value of 0.35.
Discuss what these results indicate about the biodiversity of the two areas and explain the ecological significance of a high or low D value.
Mark scheme:
1 mark for stating that a higher D value (closer to 1) indicates greater biodiversity.
1 mark for stating that a lower D value (closer to 0) indicates lower biodiversity or dominance by a few species.
1 mark for explaining that Woodland A is likely more stable, with many species of similar abundance, showing high evenness and richness.
1 mark for explaining that Woodland B is less diverse, possibly dominated by one or few species, making it less stable or more vulnerable to environmental change.
1 mark for linking biodiversity level to ecosystem resilience, such as greater ability to recover from disturbance or resist disease in the more diverse habitat.
FAQ
Species richness only counts how many species are present, ignoring how many individuals belong to each.
Simpson’s Index of Diversity (D) combines richness and evenness by considering both the number of species and their relative abundance. A habitat with ten equally abundant species has a higher D than one where nine species are rare and one dominates. This provides a more realistic assessment of biodiversity and ecological balance.
Squaring the proportion (n/N)² gives more weight to common species.
This means that species with high abundance influence the result more strongly, which highlights dominance within a community. By doing so, the index becomes sensitive to uneven distributions — a habitat dominated by one or two species will show a noticeably lower value for biodiversity.
No. The mathematical structure of the equation prevents this.
Since all squared proportions (n/N)² are positive and their sum cannot exceed 1, the value of (1 − Σ(n/N)²) always lies between 0 and 1. A value closer to 1 shows high biodiversity, while values nearer 0 indicate low biodiversity or dominance by a few species.
Larger habitats usually support more species and greater population variety, leading to higher D values.
However, the relationship is not always linear:
If a large area has uniform environmental conditions, species richness may not increase proportionally.
Habitat heterogeneity (variety in physical conditions) often has a stronger influence on biodiversity than size alone.
Consistent sampling methods are essential for fair comparison between habitats of different sizes.
Simpson’s Index is relatively stable and less affected by rare species that might appear or disappear between surveys.
This makes it ideal for tracking ecological change over time. It reflects meaningful shifts in dominant species and population balance rather than temporary fluctuations in rare species presence. Therefore, it is widely used in conservation management, habitat restoration assessment, and environmental impact studies.
