
OCR Specification focus:
‘Discuss limiting factors—carbon dioxide, light intensity, temperature, and water stress—and predict effects on rate and GP, RuBP and TP levels.’
Photosynthesis rate depends on several interacting factors. Understanding how carbon dioxide, light intensity, temperature, and water availability influence this process explains variations in plant productivity and biochemistry.
Factors Affecting Photosynthesis
The rate of photosynthesis is determined by both internal and external factors, which affect the biochemical reactions occurring in the chloroplast. A limiting factor is any condition that restricts the rate of a physiological process when other factors are in adequate supply.
Limiting Factor: The component of a process that is at the lowest level relative to need and therefore restricts the rate of the process.
When one factor is limiting, increasing it raises the photosynthetic rate until another factor becomes limiting. Understanding these limitations is crucial for predicting plant responses under changing environmental conditions.
Carbon Dioxide Concentration
Carbon dioxide (CO₂) provides the carbon source for carbohydrate synthesis during the Calvin cycle. It diffuses into leaves through stomata and is fixed by the enzyme RuBisCO into glycerate-3-phosphate (GP).
At low CO₂ concentrations, RuBisCO’s active sites are underused, reducing the formation of GP and subsequently triose phosphate (TP).
As CO₂ levels rise, the rate of carbon fixation increases until limited by another factor, such as enzyme saturation or ATP/NADPH availability from the light-dependent stage.
When CO₂ becomes limiting, RuBP accumulates because it is not being fixed, while GP and TP levels fall.
Typical limiting threshold:
Below approximately 0.04% CO₂, photosynthetic rate declines sharply.
Increasing external CO₂ concentration raises carboxylation rate and net photosynthesis until another factor (often light) becomes limiting.
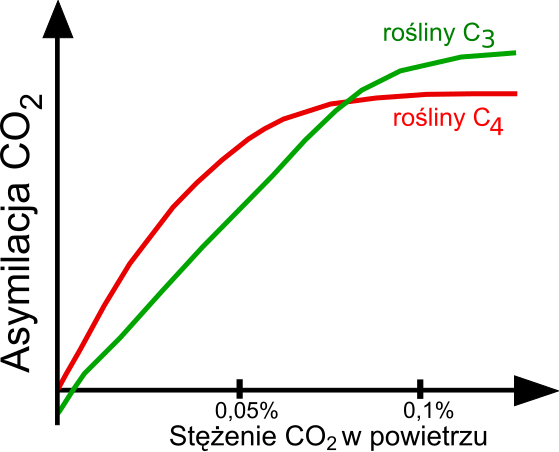
Photosynthetic rate increases with CO₂ concentration until saturation, beyond which another factor limits assimilation. The curve illustrates the CO₂-limited region and the saturation plateau. Values beyond the plateau do not increase rate unless light, temperature or biochemistry change. Source.
Light Intensity
Light intensity provides the energy for the light-dependent reactions that generate ATP and reduced NADP (NADPH) for the Calvin cycle.
Increasing light intensity raises ATP and NADPH production, enhancing the conversion of GP to TP.
At low light intensity, insufficient ATP and NADPH slow these conversions, leading to accumulation of GP and a decrease in TP and RuBP regeneration.
Above a certain intensity, the photosynthetic rate plateaus as other factors (e.g., CO₂ or temperature) become limiting.
Light quality also matters:
Red and blue wavelengths are absorbed most effectively by chlorophylls.
Green light is largely reflected, explaining the green colour of leaves.
When light intensity is extremely high, photoinhibition can occur, damaging photosystems and reducing efficiency.
Photoinhibition: The light-induced reduction in photosynthetic efficiency due to damage to the photosystems from excessive light energy.
Temperature
Temperature affects the enzymes that catalyse photosynthetic reactions, particularly those in the Calvin cycle such as RuBisCO and glyceraldehyde-3-phosphate dehydrogenase.
At low temperatures, enzymes have reduced kinetic energy, slowing both the light-independent and light-dependent reactions.
As temperature increases, enzyme activity rises, and the photosynthetic rate increases until reaching an optimum.
Beyond the optimum, enzyme denaturation occurs, causing a rapid fall in rate.
High temperatures may also:
Enhance photorespiration, where RuBisCO binds oxygen instead of CO₂, producing phosphoglycolate and wasting ATP.
Increase transpiration, potentially leading to stomatal closure and reduced CO₂ uptake.
In many temperate plants, photosynthesis peaks around 25–30°C.
Temperature alters enzyme kinetics (e.g. RuBisCO) so the photosynthetic rate shows an optimum; at any given temperature, higher light shifts the attainable rate upward until another factor limits.
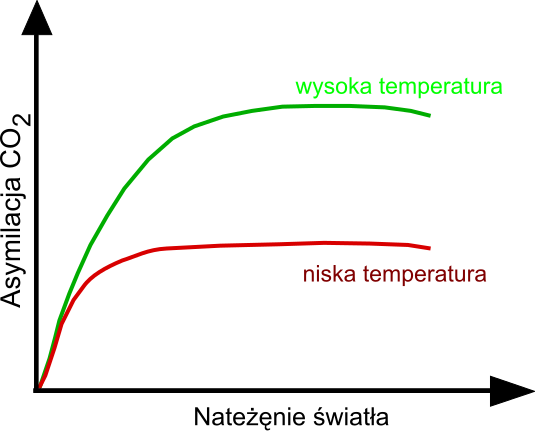
Graph showing photosynthetic rate versus temperature at low and high light. Each curve peaks at an optimum temperature and declines with enzyme denaturation or increased photorespiration. The higher-light curve lies above the lower-light curve, illustrating light–temperature interactions. Source.
Photorespiration: A wasteful process in which RuBisCO fixes oxygen instead of carbon dioxide, reducing photosynthetic efficiency and producing toxic by-products.
Water Stress
Water is not a direct substrate for carbon fixation but is essential for maintaining turgor, enzyme function, and electron supply through photolysis.
Under water stress:
Stomata close to prevent further water loss, reducing CO₂ availability and thus lowering photosynthetic rate.
Thylakoid membranes may become damaged, reducing efficiency of the light-dependent reactions.
Reactive oxygen species (ROS) may accumulate, damaging chloroplast structures.
This stress indirectly affects the Calvin cycle because less ATP and NADPH are produced, leading to reduced TP formation and RuBP regeneration.
Under water stress, reduced leaf water potential causes stomatal closure, lowering CO₂ diffusion into the stroma and decreasing the photosynthetic rate.
Interactions Between Limiting Factors
Photosynthesis rarely depends on a single factor in isolation. The interaction between factors determines the overall rate:
At low light intensity, increasing CO₂ concentration has little effect since light is limiting.
At high light intensity, CO₂ concentration becomes more influential.
Temperature modifies these relationships by altering enzyme efficiency.
The Law of Limiting Factors, proposed by F. F. Blackman, summarises this relationship: when a process is limited by several factors, the rate is determined by the factor closest to its minimum value.
Law of Limiting Factors: The rate of a physiological process will be limited by the factor in shortest supply, even when others are optimal.
Effects on GP, RuBP, and TP Levels
The levels of glycerate-3-phosphate (GP), ribulose bisphosphate (RuBP), and triose phosphate (TP) fluctuate depending on which factor is limiting:
Low light intensity
ATP and NADPH production fall.
GP accumulates, as it cannot be reduced to TP.
TP and RuBP concentrations decrease.
Low CO₂ concentration
RuBP accumulates, as it is not being used by RuBisCO.
GP and TP levels fall due to reduced carbon fixation.
High temperature
RuBisCO’s affinity for oxygen increases, promoting photorespiration.
Reduced Calvin cycle efficiency lowers TP and GP production.
These changes directly affect carbohydrate synthesis and plant growth rates.
EQUATION
—-----------------------------------------------------------------
General Photosynthesis Equation = 6CO₂ + 6H₂O → C₆H₁₂O₆ + 6O₂
CO₂ = Carbon dioxide (substrate for Calvin cycle)
H₂O = Water (electron and proton source via photolysis)
C₆H₁₂O₆ = Glucose (energy storage molecule)
O₂ = Oxygen (by-product of photolysis)
—-----------------------------------------------------------------
Measuring Limiting Factors
Experimentally, the rate of photosynthesis can be inferred through:
Oxygen production using aquatic plants.
CO₂ uptake measured via pH change.
Dry mass increase of plants over time.
Graphical analysis of rate versus factor often shows an initial linear increase followed by a plateau when another factor becomes limiting. Understanding these relationships is key to optimising plant growth in agriculture and ecological modelling.
Practice Questions
Question 1 (2 marks)
Explain what is meant by a limiting factor in photosynthesis.
Mark Scheme:
1 mark for correctly defining a limiting factor: any factor that restricts the rate of a process when it is in shortest supply.
1 mark for correctly applying it to photosynthesis: when one factor (e.g., light, CO₂, temperature, or water) is below its optimum, it limits the rate of photosynthesis even if others are sufficient.
Question 2 (5 marks)
Describe and explain how changes in light intensity and carbon dioxide concentration affect the levels of RuBP, GP, and TP in the Calvin cycle.
Mark Scheme:
1 mark: States that in low light intensity, less ATP and NADPH are produced in the light-dependent reactions.
1 mark: Explains that with less ATP and NADPH, GP cannot be reduced to TP, causing GP to accumulate and TP levels to fall.
1 mark: States that RuBP levels also fall because TP is needed to regenerate RuBP.
1 mark: Explains that in low CO₂ concentration, RuBisCO cannot fix carbon, so RuBP accumulates while GP and TP levels decrease.
1 mark: Provides an overall understanding that the availability of ATP, NADPH, and CO₂ determines Calvin cycle intermediates and thus limits the overall rate of photosynthesis.
FAQ
Photorespiration occurs when RuBisCO binds to oxygen instead of carbon dioxide, forming phosphoglycolate instead of GP. This process uses ATP and releases previously fixed carbon, effectively wasting energy and carbon skeletons.
At high temperatures or low CO₂ concentrations, RuBisCO’s affinity for oxygen increases, making photorespiration more frequent.
Energy is expended recycling phosphoglycolate.
Less carbon is available for glucose synthesis.
This reduces the overall net productivity of photosynthesis in many C₃ plants.
During water stress, plants lose water through transpiration. To conserve water, they close their stomata to reduce further loss.
However, this limits CO₂ diffusion into the leaf, reducing carbon fixation in the Calvin cycle.
GP and TP formation decreases.
RuBP accumulates because it is not being used by RuBisCO.Extended stomatal closure can therefore cause a significant drop in photosynthetic rate and growth.
Plants have evolved various adaptations to cope with environmental limitations.
Examples include:
C₄ plants (e.g., maize): spatially separate CO₂ fixation to reduce photorespiration in hot, dry conditions.
CAM plants (e.g., cacti): open stomata at night and store CO₂ as malate for daytime photosynthesis.
Sun and shade leaves: sun leaves have more chloroplasts and thicker palisade layers to optimise light absorption.
These adaptations enable photosynthesis to continue efficiently despite extreme environmental stresses.
Common methods include:
Oxygen production in aquatic plants using gas sensors or counting bubbles (e.g., with Elodea).
CO₂ uptake by monitoring pH change in water (acidic CO₂ forms carbonic acid).
Biomass accumulation over time under different light, temperature, or CO₂ conditions.
Each method indirectly measures photosynthetic rate, and controlled experiments allow identification of the limiting factor under specific conditions.
In prolonged shade or low light intensity, plants adapt their pigment composition to maximise light capture.
Chlorophyll b concentration increases relative to chlorophyll a, broadening the spectrum of absorbed light.
Accessory pigments like carotenoids help absorb wavelengths less efficiently captured by chlorophyll.
Thylakoid arrangement may adjust to improve photon capture.
These changes enhance the light-harvesting efficiency of photosystems but may reduce total ATP and NADPH output due to the lower energy input overall.
