
OCR Specification focus:
‘Different atoms produce unique spectral lines, enabling identification of stellar elements.’
Stellar light carries detailed information about its source, and analysing spectral fingerprints enables astronomers to determine a star’s elemental composition by identifying distinctive atomic line patterns.
Understanding Spectral Fingerprints
Every chemical element displays a characteristic set of spectral lines, forming what are often called spectral fingerprints because they uniquely identify the element responsible. When starlight passes through a star’s cooler outer layers or interstellar material, atoms absorb specific wavelengths corresponding to electron transitions. This produces a structured pattern that can be examined using instruments such as spectrometers. These patterns allow astronomers to determine not only the presence of particular elements but also insights into stellar processes, atmospheric conditions, and evolutionary stages.
The Origin of Spectral Fingerprints
The unique nature of spectral fingerprints arises from the quantised energy levels of electrons in atoms. Because each element has a distinct nuclear charge and electron configuration, its energy levels differ from those of any other element. As a result, electrons in different atoms can only absorb or emit photons of precise energies.
Energy Levels: The discrete, fixed energies that electrons in an atom may occupy, each corresponding to a specific electron configuration.
When an electron moves between these defined energy levels, a photon is involved in the transition. This action produces a wavelength that can be measured and matched to a particular element. The detection of these wavelengths forms the basis of astrophysical spectroscopy.
A short interval of normal explanation must occur here, ensuring definitions remain clearly separated and the narrative stays accessible.
Emission and Absorption as Spectral Indicators
Two main types of atomic transitions contribute to spectral fingerprints seen in astronomical observations:
Absorption lines, formed when atoms absorb photons from a continuous source of light and electrons move to higher energy levels.
Emission lines, produced when electrons fall back to lower energy levels, releasing photons that appear as bright lines against a darker background.
These two complementary processes allow astronomers to identify elements in both hot, low-density gas regions and cooler stellar atmospheres where absorption dominates. Because the exact wavelengths of these transitions are fixed for each element, even faint or distant stars can be analysed reliably.
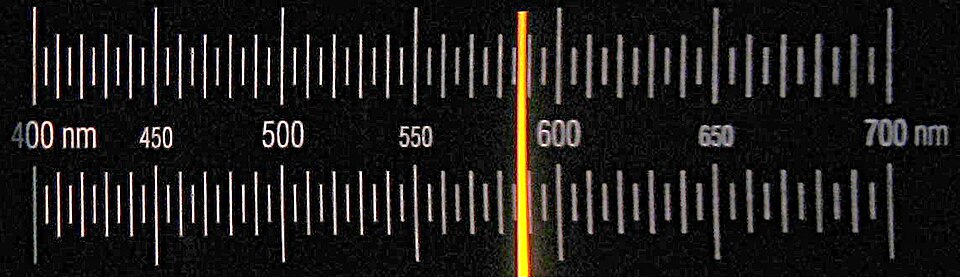
Sodium emission spectrum showing the characteristic D-line doublet around 589 nm. The close pair demonstrates how a simple two-line pattern uniquely identifies sodium. This does not introduce content beyond the spectral fingerprint concept in the syllabus. Source.
EQUATION
—-----------------------------------------------------------------
Photon Energy (E) = hf
h = Planck’s constant (J s)
f = Frequency of the photon (Hz)
—-----------------------------------------------------------------
This relationship shows how each observed wavelength corresponds precisely to an electron transition, linking what is measured in a spectrum to the internal structure of atoms.
A normal explanatory sentence is included here to maintain the required spacing between blocks and preserve clarity for the reader.
Why Spectral Fingerprints Are Unique
The uniqueness of spectral fingerprints is rooted in the distinct arrangement of electrons within each type of atom. Because no two types of atoms share identical electron structures, the transitions available to their electrons differ both in energy and in number. This leads to:
Unique wavelengths for each permitted transition.
Distinctive patterns when all lines for an element are considered together.
Reliable identification capability, even when many lines overlap in dense stellar spectra.
Spectral fingerprint patterns remain unchanged regardless of the star in which the element is found, making them powerful tools for universal identification.
Interpreting Stellar Spectra
Spectral fingerprints are extracted by dispersing starlight using a prism or diffraction grating to spread the light into its component wavelengths. A spectrometer records how much light is present at each wavelength, revealing dark absorption dips or bright emission peaks. In the context of stellar atmospheres:
Cooler outer layers absorb light from the hot inner regions, producing the familiar absorption line spectra associated with most stars.
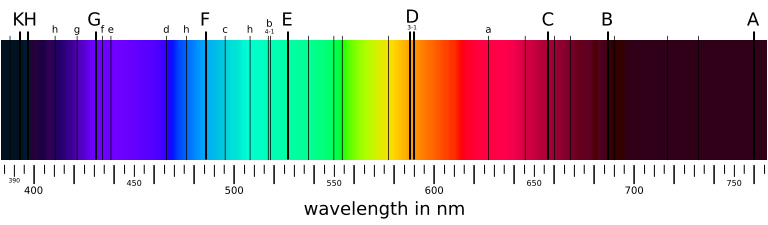
Solar spectrum displaying Fraunhofer absorption lines, each marking a wavelength at which atoms in the Sun’s atmosphere remove light. These dark features form element-specific spectral fingerprints used to determine stellar composition. Source.
Hot, diffuse gas clouds surrounding young or dying stars may instead display emission lines.
Metallicity, meaning the proportion of elements heavier than helium in a star, can be measured from the relative strength of different spectral fingerprints.
These spectral clues enable astrophysicists to construct models of stellar interiors, ages, and compositions.
Practical Uses of Spectral Fingerprinting in Astrophysics
Spectral fingerprints are not merely identifiers; they are essential diagnostic tools. Through careful analysis, astronomers can determine:
Elemental composition, including trace elements present in tiny quantities.
Temperature, since different atomic transitions occur more readily at certain energies.
Density and pressure, inferred from the broadening of spectral lines.
Motion, using Doppler shifts in line positions to detect radial velocities.
Magnetic fields, measured through the splitting of lines in the Zeeman effect.
Each of these derives from the foundational principle that every atom leaves a measurable imprint on a star’s emitted or absorbed light.
Because these fingerprints are constant and reproducible, they provide a rigorous method for comparing observations across vast distances and time scales. Spectroscopy remains one of the most powerful and precise methods in astrophysics, and understanding spectral fingerprints is vital for interpreting the light collected from stars, nebulae, and galaxies.
Hydrogen emission spectrum
“Emission lines, produced when electrons fall back to lower energy levels, releasing photons that appear as bright lines against a darker background.”

Hydrogen emission spectrum showing the labelled Balmer lines, each corresponding to a specific electron transition. These bright features represent a clear and widely used example of an element’s spectral fingerprint. Source.
Practice Questions
Question 1 (2 marks)
Explain why different elements produce unique spectral fingerprints when observed in stellar spectra.
Mark scheme:
1 mark: States that different elements have distinct electron energy levels.
1 mark: Links this to each element producing absorption or emission lines at unique, specific wavelengths.
Question 2 (5 marks)
A distant star is observed using a spectrometer. The spectrum shows several dark absorption lines that match the known wavelengths of hydrogen and calcium.
Describe how these spectral features are formed and explain how astronomers use them to determine the elemental composition of the star.
Mark scheme:
1 mark: Absorption lines occur when photons of specific wavelengths are absorbed by electrons moving to higher energy levels.
1 mark: States that each element has unique allowed transitions, giving fixed wavelengths.
1 mark: Explains that matching observed wavelengths to known laboratory values identifies elements present.
1 mark: Notes that hydrogen and calcium are inferred because their line patterns correspond to the measured absorption lines.
1 mark: Recognises that this method works even for distant stars because spectral fingerprints are universal and independent of the star’s environment.
FAQ
Spectroscopists use high-resolution spectrometers that spread light over a larger wavelength range, increasing the separation between nearby lines.
They also compare observed spectra with laboratory reference spectra. Even when lines overlap, the relative spacing, intensity patterns, and known broadening effects help distinguish the contributing elements.
Advanced fitting techniques may be used to model line shapes mathematically, allowing blended features to be decomposed into individual elemental contributions.
Spectral lines can broaden due to Doppler effects from thermal motion, rotation, or turbulence, as well as pressure broadening in denser environments.
Astronomers account for this by analysing the width and shape of each line.
Very broad lines often imply high temperatures or rapid rotation.
Pressure broadening is associated with dense stellar layers.
These factors allow researchers to extract physical conditions while still identifying the underlying element.
Some atoms have transitions that produce strong absorption or emission features because their electrons are easily excited at stellar temperatures.
In addition, certain wavelengths fall in regions where the star emits more light, increasing the contrast of those lines.
Highly opaque transitions, such as strong resonance lines, can dominate the spectrum even when the element is present only in trace amounts.
Ionised atoms have different energy levels from their neutral counterparts, so their spectral fingerprints consist of entirely separate sets of transitions.
In hot stars, many elements are partially or fully ionised, so their neutral lines may weaken or disappear.
This means astronomers must use ionisation-specific line tables to correctly identify elements in hotter stellar environments.
They compare line shapes and Doppler shifts.
Stellar lines share the same radial velocity shift as the rest of the star’s spectrum.
Interstellar lines are usually narrower and may show different velocity shifts.
Atmospheric (telluric) lines remain fixed relative to the observer and do not shift with the star’s motion.
By checking these characteristics, astronomers can reliably determine the origin of each spectral feature.
