
OCR Specification focus:
‘Follow written instructions accurately, make and record observations and measurements with care, and maintain clear, accurate records of activities.’
Following precise instructions, accurately measuring physical quantities, and maintaining reliable records are essential aspects of scientific practice. These skills ensure reproducibility, credibility, and effective analysis in experimental physics.
Following Written Instructions Accurately
Scientific investigations rely on methodical adherence to written protocols. This ensures that all procedures are consistent and repeatable, allowing other scientists to obtain comparable results.
Importance of Following Instructions
When conducting experiments, written instructions define the sequence of operations, the equipment setup, and the data collection method. Failure to follow them exactly can lead to systematic errors, unreliable data, or unsafe conditions. Students must read all instructions thoroughly before beginning any procedure.
Strategies for Accurate Execution
Read through the entire procedure before starting to identify required equipment and potential hazards.
Highlight or annotate key procedural steps, measurements, or calibration details.
Confirm understanding of each instruction; if unclear, seek clarification before proceeding.
Carry out a dry run (without data collection) to ensure proper setup and familiarity with apparatus.
Check calibration of measuring instruments before taking readings to ensure accuracy.
Accurate execution also means avoiding assumption-based shortcuts. Even small deviations, such as misaligning apparatus or neglecting zeroing instruments, can compromise results.
Making and Recording Measurements with Care
Measurements form the foundation of all experimental results. In A-Level Physics, students must understand precision, accuracy, uncertainty, and error in order to interpret data correctly.
Understanding Measurement Quality
Precision: The degree to which repeated measurements under unchanged conditions show the same results.
Accuracy: How close a measured value is to the true or accepted value.
A measurement can be precise but inaccurate if systematic errors are present, such as incorrect zeroing. In contrast, random errors arise from unpredictable variations in readings and affect precision.
Reducing Measurement Errors
To obtain high-quality data, students should:
Repeat measurements and calculate a mean to reduce random errors.
Use appropriate instruments with scales fine enough for required precision.
Read analogue scales at eye level to avoid parallax error.
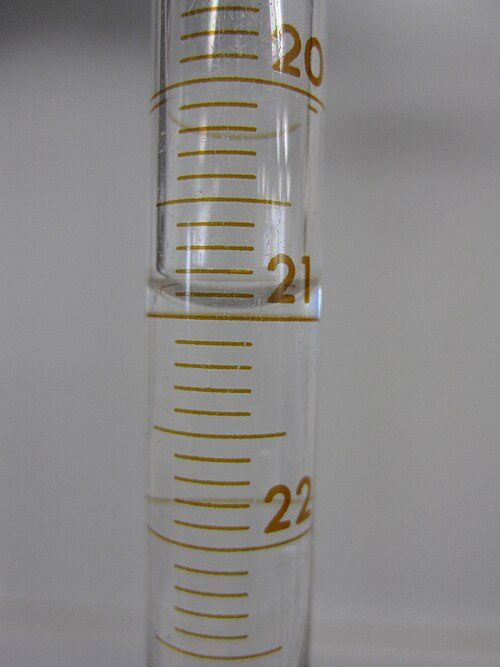
Correct meniscus reading in a burette: for a concave meniscus (e.g., water), read the bottom of the curve at eye level to avoid parallax error. This practice ensures accurate volume measurements when recording data. Source.
Record environmental conditions (e.g., temperature, humidity) that may influence results.
Ensure stability of apparatus before reading measurements.
EQUATION
—-----------------------------------------------------------------
Percentage Uncertainty (%) = (Absolute Uncertainty / Measured Value) × 100
Absolute Uncertainty = ± smallest division or estimated reading error
Measured Value = recorded reading of the quantity
—-----------------------------------------------------------------
Between any two readings, consider whether the uncertainty has been propagated, especially when combining measurements in calculations.
Recording Data and Observations
Recording is not merely writing down numbers—it represents systematic documentation of the experimental process.
Best Practices for Recording
Use clearly labelled tables with headings that include units in brackets (e.g., Length (cm), Time (s)).
Record all raw data, even if it appears inconsistent, without erasing or altering original values.
Maintain chronological order in recording to trace procedural development.
Use decimal places consistently according to the measuring instrument’s precision.
Avoid rounding until the final stage of analysis to preserve data integrity.
Each observation, whether qualitative (colour change, pattern formation) or quantitative (measured value), must be objective and unambiguous.
Using Notebooks or Digital Logs
Practical records should be kept in laboratory notebooks or secure digital formats.
Paper records must be in pen, legible, and signed with date and experiment title.
Digital tools such as spreadsheets or lab management software can help organise data systematically and perform calculations accurately.
Always back up digital data and ensure version control when multiple entries or revisions occur.
Measurement Techniques and Tools
Different measurements demand specific instruments and careful technique to ensure validity.
Common Instruments and Their Proper Use
Rulers and metre rules: Read from the zero mark, not the end edge; use consistent units.
Vernier callipers and micrometers: Measure small dimensions with high precision; note zero error and correct accordingly.
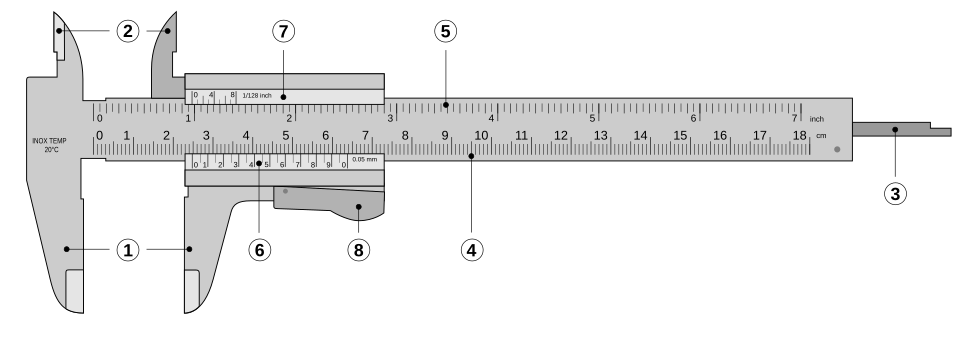
Vernier caliper with labelled jaws, scales and depth probe. The vernier enables readings beyond the main scale’s smallest division, improving precision and reducing random error. The clean layout supports accurate scale interpretation without clutter. Source.
Thermometers: Wait until the reading stabilises before recording; avoid touching the bulb with fingers.
Balances: Zero the scale before use; ensure the balance is on a level surface.
Stopwatches or timers: Start and stop with care to minimise reaction time errors.
Zero Error: The reading shown by a measuring instrument when the true value should be zero.
Understanding instrument limitations and applying corrections helps minimise systematic bias in experimental results.
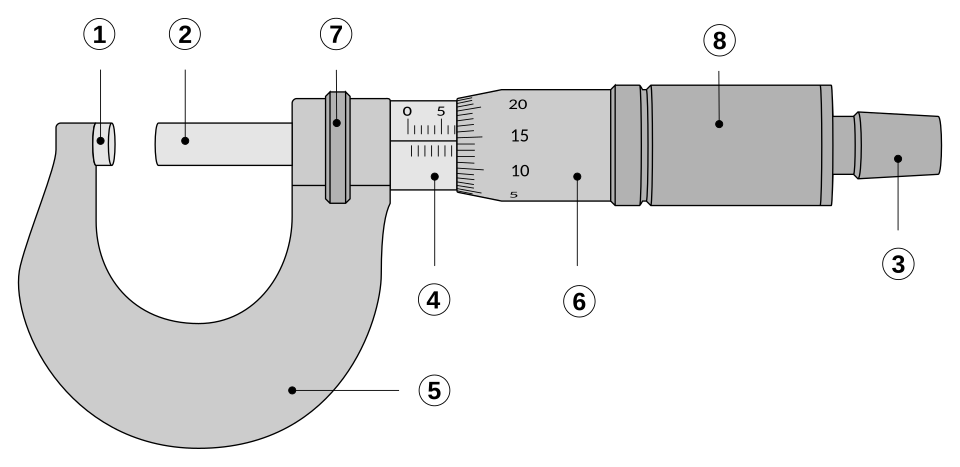
Micrometer screw gauge showing anvil, spindle, sleeve and thimble scales. Fine pitch and vernier-style markings enable 0.01 mm resolution, supporting precise length measurements. Note the ratchet stop to apply consistent measuring force. Source.
Maintaining Clear and Accurate Records of Activities
Good scientific documentation ensures traceability—the ability to verify results and reproduce an experiment.
Key Recording Principles
Each experimental entry should include:
Date, title, and objective of the investigation
Apparatus list with specifications
Step-by-step method followed
Raw data and calculated results
Error analysis and comments on anomalies
Avoid rewriting results to make them appear neater; authenticity is valued over presentation perfection.
Where corrections are necessary, strike through once and write the corrected value beside it—never erase or obscure data.
Integrity and Professional Conduct
Maintaining clear records supports ethical practice in physics. Altering or fabricating data is a serious academic misconduct. Instead, uncertainties and errors should be reported transparently, acknowledging the limits of experimental precision.
Linking Measurement and Communication
Data recording naturally connects to data presentation and analysis. An experiment is incomplete unless measurements are communicated clearly.
Use scientific conventions for significant figures, units, and notation.
Represent relationships through graphs or charts, plotting dependent variables on the y-axis and independent variables on the x-axis.
Indicate error bars where appropriate to show uncertainty visually.
Good measurement practice ensures that final results are trustworthy, reproducible, and meaningful, forming the foundation of all future experimental conclusions in physics.
Practice Questions
Question 1 (2 marks)
A student is instructed to measure the diameter of a thin copper wire using a micrometer screw gauge.
(a) Explain why the student should take several measurements along the wire and calculate a mean diameter.
Mark scheme:
(1 mark) States that taking several measurements helps to identify variations or irregularities in the wire’s thickness.
(1 mark) States that calculating the mean value reduces the effect of random errors and increases the reliability of the measurement.
Question 2 (5 marks)
A student is following an experimental procedure to determine the acceleration due to gravity, g, by measuring the time it takes for a small ball to fall a known distance.
(a) Describe the steps the student should take to ensure the measurements of time and distance are accurate and recorded correctly.
(b) Explain how the student should present the results to demonstrate precision and reliability.
Mark scheme:
(a) (Up to 3 marks)
(1 mark) Reads and follows the written instructions carefully, checking apparatus setup before taking measurements.
(1 mark) Measures the distance using a metre rule, ensuring the ruler is vertical and readings are taken at eye level to avoid parallax error.
(1 mark) Uses a stopwatch or electronic timer, starting and stopping it accurately, possibly timing multiple falls to reduce reaction time error and find a mean.
(b) (Up to 2 marks)
(1 mark) Records data in a clearly labelled table with units in headings and consistent decimal places according to instrument precision.
(1 mark) Presents processed results, such as means or graphs, including uncertainties or error bars to show the reliability and precision of the measurements.
FAQ
Environmental factors such as temperature, humidity, and air pressure can affect the accuracy of physical measurements. For example, metal rulers and wires expand slightly when heated, leading to systematic errors if unaccounted for.
Recording these conditions allows students to identify possible sources of error and, where relevant, apply corrections. It also ensures that results are comparable if the experiment is repeated under different conditions.
Common mistakes include:
Viewing the scale from an angle rather than directly in line (causing parallax error).
Misreading the zero mark or scale interval.
Estimating between divisions inconsistently.
To avoid these:
Align your eye with the reading mark.
Check calibration before use.
Practise consistent estimation when interpolating between scale markings.
Uncertainties should be shown beside the measured value, usually in the same unit, for clarity.
For example: Length = 12.4 ± 0.1 cm
Best practice:
Include uncertainty for every measured quantity.
Keep decimal places consistent with the measured value.
Record uncertainties in the table header if the same value applies to all readings.
This shows precision transparently and supports later uncertainty propagation in calculations.
Original data, even if mistaken, provides evidence of the measurement process. Erasing data prevents reviewers from verifying where errors occurred or assessing how the experiment developed.
Instead, strike through incorrect entries neatly and record the correction beside them. This maintains data integrity, aligns with professional scientific practice, and demonstrates honest experimental reporting.
Digital instruments are ideal when:
Readings change rapidly, and quick recording is needed.
High precision or automatic data logging improves consistency.
The risk of human reading error (like parallax) must be minimised.
However, analogue instruments may still be preferred for observing trends, estimating changes continuously, or verifying calibration. The choice depends on the measurement’s required precision and the context of the investigation.
