
AP Syllabus focus:
‘Decide from a graph whether a limit exists at a point, including recognizing cases where left and right limits disagree, or where the function is unbounded or oscillates.’
Understanding when a graphical limit exists requires careful attention to how the function behaves near a point, focusing on approaching values rather than specific plotted points or discontinuities.
Recognizing Graphical Limits
Graphical limits describe the value a function’s y-values approach as x approaches a specific point. Whether a limit exists depends on the consistency and predictability of this behavior from both sides of the point.
The Role of Nearby Behavior
A graph communicates how a function behaves by illustrating trends, jumps, breaks, or wild fluctuations. A limit at a point exists only when the function’s approach values from the left and right coordinate with one another. This relies on studying the graph close to a target value of x, not necessarily at the point itself.
Left-Hand and Right-Hand Behavior
A two-sided limit exists at only when:
The left-hand limit approaches a single value.
The right-hand limit approaches the same value.
Neither approach exhibits unbounded or irregular oscillatory behavior.
If these conditions fail, the limit does not exist, regardless of the function’s defined value at .
Situations Where Limits Exist
Limits often exist even when a function is not defined at the point or shows visual breaks on the graph. The key is consistency in approach behavior.
Common Graphical Indicators of an Existing Limit
A smooth or piecewise-smooth curve approaching one height from both sides.
A hole in the graph at the point, where the graph approaches but does not reach a specific y-value.
A filled point located away from the approaching height (the limit depends on nearby behavior, not function value at the point).
These features emphasize that continuity is not required for the existence of a limit.
Graphically, the three most common “problem behaviors” at a point are a hole, a jump, or a vertical asymptote.
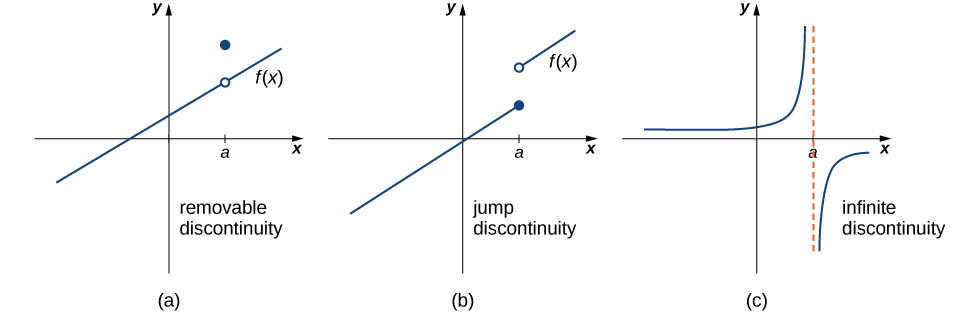
This figure illustrates removable, jump, and infinite discontinuities. In the removable case, the limit exists despite the missing point. In the jump and infinite cases, the left and right behaviors do not approach a single value, so the limit fails to exist. Source.
When Graphical Limits Do Not Exist
Several distinct behaviors prevent a limit from existing at a point. Each reflects a failure of the left side and right side to agree on a single y-value.
Jump Discontinuities
A jump discontinuity occurs when the left-hand and right-hand limits settle at different y-values.
Jump Discontinuity: A discontinuity where the one-sided limits exist but are unequal, causing an abrupt vertical “jump” in the graph.
A sentence to provide spacing before another definition.
Infinite (Unbounded) Behavior
A limit fails to exist when the graph grows without bound near the target point.
Infinite Limit: A limit in which the function values increase or decrease without bound as approaches a point from at least one side.
Oscillatory Behavior
A limit does not exist if the graph oscillates infinitely often between multiple values near the point, preventing the function from settling near any single number. This can be gentle wavering or extreme, rapidly tightening oscillations.
In other cases, a limit fails to exist because the graph oscillates more and more rapidly or because the y-values grow without bound as x approaches the point.
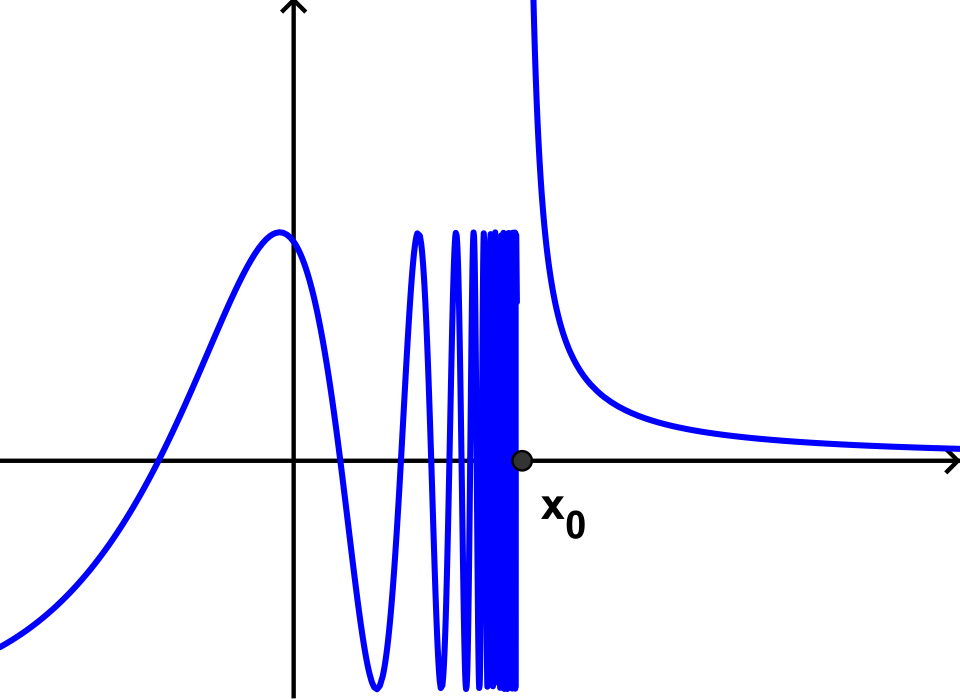
This graph depicts oscillatory behavior on one side and unbounded growth on the other. In both cases, the function fails to approach a single limiting value. Although the specific formulas exceed typical AP examples, the visual behaviors reflect the oscillation and divergence students must identify. Source.
Missing or Ambiguous Graph Detail
A limit may appear to exist when the graph’s scale conceals rapid variation. Real-world graphs can hide complexity if:
The zoom level is too coarse.
Key behavior occurs in a narrow region not visible.
Important detail is obscured due to resolution or stylization.
In such cases, students must be attentive to whether the graph truly shows consistent behavior or merely suggests it.
Interpreting Ambiguous Features
Certain visual cues on a graph require disciplined interpretation to avoid misidentifying limits.
Open and Closed Circles
Graphical notation distinguishes between the approach behavior and the function's actual value using open circles (excluded points) and closed circles (included points). Only the approaching trend matters for limit evaluation.
Gaps and Breaks
A graph may have a gap where the function is undefined or switches expression. If both sides approach the same height, the limit exists; otherwise, the limit does not. Students must focus on the height approached, not the existence or location of plotted points.
Sharp Corners and Cusps
A sharp turn in the graph may look dramatic, but limits typically still exist unless there is a jump or unbounded behavior. These features often mislead students into believing limits fail when they do not.
A Structured Process for Evaluating Graphical Limits
To determine whether a limit exists at , follow this systematic approach:
Trace the graph from the left and identify the y-value approached as nears .
Trace the graph from the right to determine the corresponding approach value.
Compare the left-hand and right-hand approach values for equality.
Check for unbounded or oscillatory behavior that prevents the function from settling near a value.
Ignore isolated points or filled/open circles at ; they do not influence the limit.
Reevaluate ambiguous regions with attention to scale or potential hidden detail.
Understanding Limits Through Graphical Consistency
Graphical limits hinge on whether a function behaves consistently as it approaches a target value. When the graph shows coordinated left-hand and right-hand approach values and avoids unbounded or oscillatory tendencies, a limit exists. When those conditions fail, the limit does not exist, aligning directly with the syllabus emphasis on identifying such cases from the graph alone.
Practice Questions
Question 1 (1–3 marks)
The graph of a function f is shown near x = 2. As x approaches 2 from the left, the graph approaches a y-value of 3. As x approaches 2 from the right, the graph approaches a y-value of 5.
(a) State whether the limit of f as x approaches 2 exists.
(b) Justify your answer using the behaviour of the graph.
Question 1
(a)
• 1 mark: Correct statement that the limit does not exist.
(b)
• 1 mark: Correct explanation that the left-hand and right-hand limits approach different values.
• 1 mark: Explicit reference to the values 3 and 5 being unequal.
Question 2 (4–6 marks)
A function g is defined on an open interval around x = 4. The graph has the following features:
• As x approaches 4 from the left, g oscillates between two values, never settling near a single height.
• As x approaches 4 from the right, g increases without bound.
• The value g(4) is defined and equal to 1.
(a) Determine whether the limit of g as x approaches 4 exists.
(b) Explain clearly why the graph’s behaviour leads to your conclusion.
(c) State whether g is continuous at x = 4, giving a brief reason.
Question 2
(a)
• 1 mark: Correct statement that the limit does not exist.
(b)
• 1 mark: Explanation that the left-hand side oscillates and therefore has no single approach value.
• 1 mark: Explanation that the right-hand side becomes unbounded as x approaches 4.
• 1 mark: Statement that because neither side approaches a single finite value, the two-sided limit cannot exist.
(c)
• 1 mark: Correct statement that g is not continuous at x = 4.
• 1 mark: Reasoning that continuity requires the limit to exist and equal g(4), which does not occur.
FAQ
A graph must depict the function’s behaviour sufficiently close to the point of interest. Small-scale features can change the limit entirely.
Inaccurate or loosely drawn curves may hide oscillations, subtle jumps, or rapid unbounded growth.
A reliable graph typically shows:
• a clear trend on both sides of the point
• consistent scaling on the axes
• enough zoom near the critical x-value to reveal fine behaviour
When the resolution is poor, a graph can suggest a limit exists even when it does not.
Yes. Graphs drawn at an insufficient scale may smooth out behaviour that invalidates a limit.
A limit can seem to exist if:
• oscillations become too fine to display
• the graph approaches a vertical asymptote that lies outside the current zoom window
• discontinuities are hidden by plotting software smoothing the curve
Closer inspection or multiple graph views may be required to confirm the limit.
Limits depend on nearby behaviour, not the value at the point itself.
Even if a plotted point sits far above or below the approaching trend, the limit remains governed by:
• the left-hand approach value
• the right-hand approach value
A graph may deliberately place a filled dot away from where the curve approaches, illustrating that function value and limit are conceptually separate.
Rapid oscillation appears as tightening waves or dense zig-zag patterns near a point.
Typical signs include:
• repeated crossings of the same vertical line
• shrinking wavelength as x approaches the point
• an inability to trace the graph to a single height
When oscillation does not settle, a limit cannot exist, even if the graph looks almost level at a coarse scale.
A vertical asymptote is indicated by the function’s values growing without bound as they near a particular x-value.
Helpful distinctions include:
• the graph approaching a vertical line extremely closely without crossing
• symmetry or consistent directional approach on each side of the line
• the y-values increasing or decreasing dramatically with minimal horizontal movement
A steep curve still points toward a finite y-value, whereas an asymptote does not.
