
AP Syllabus focus:
‘Estimate limits of a function from its graph, including one-sided and two-sided limits, by examining the y-values the graph approaches as x approaches a specific point.’
Understanding how a function behaves near a point is essential in calculus, and graphs provide an immediate visual way to estimate both one-sided and two-sided limits with accuracy.
Estimating Limits from Graphical Behavior
When reading a graph to determine a limit, the goal is to analyze the y-values that the graph approaches as the x-value gets arbitrarily close to a chosen point. The function’s value at that point may or may not match the limit, but limits depend only on nearby behavior, not on the actual function value.
The Concept of Approaching a Point on a Graph
A limit describes the value a function gets close to, not necessarily reaches. On a graph, this is seen by tracing the curve toward a particular x-value. If the curve levels toward a specific y-value as x nears that point, the limit corresponds to that y-value.
Two-Sided Limits
A two-sided limit considers the behavior of a function from both the left and the right of a point.
A two-sided limit exists only when the function approaches the same y-value from both directions.
Two-Sided Limit: The value a function approaches as x approaches a point from both the left and the right, provided both sides approach the same number.
A two-sided limit focuses solely on the trend in the graph, ignoring jumps, holes, or the actual function value at the point. If the left-hand and right-hand trends differ, the two-sided limit does not exist.
Two-sided limits are visually identifiable when the curve meets smoothly or approaches a shared y-value, even if there is an open circle or missing point.
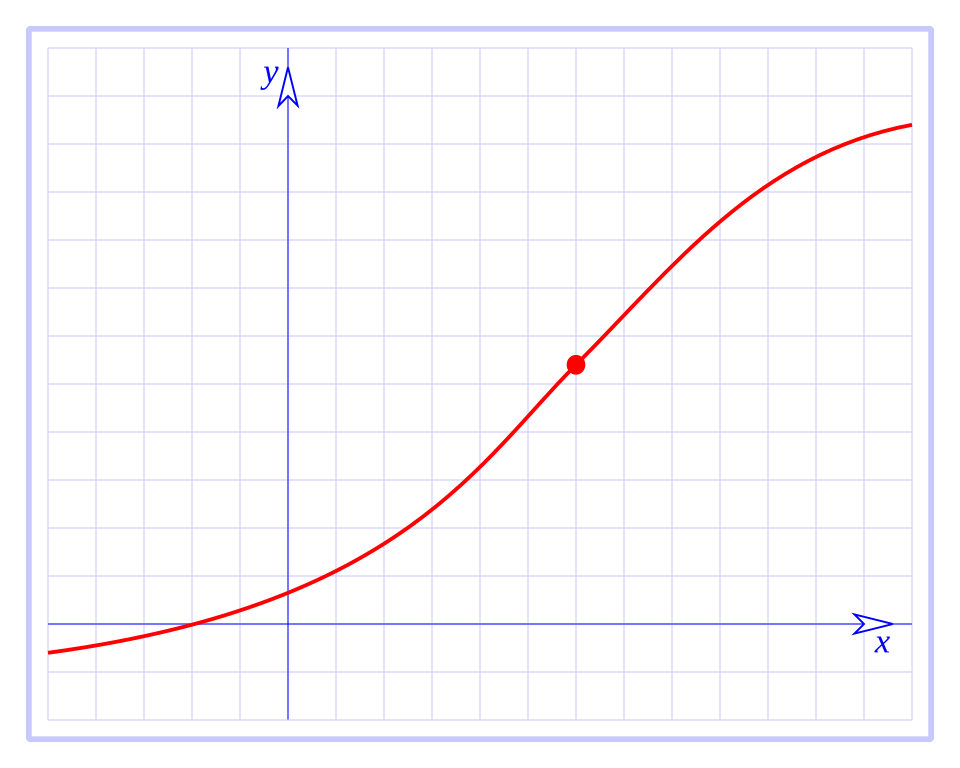
A continuous function smoothly approaching the same y-value from both sides of a point, illustrating the existence of a two-sided limit. The decorative grid and frame help with visual precision but exceed what AP students strictly need. Source.
One-Sided Limits
A one-sided limit examines the function approaching a point from only one direction.
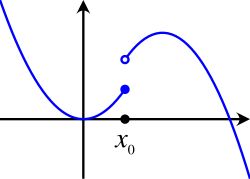
A function approaching an open point from below, demonstrating that a one-sided limit can differ from the function’s actual value. The file references lower semicontinuity, which is more advanced than required for AP Calculus AB. Source.
This is crucial when the graph behaves differently on each side.
One-Sided Limit: The value a function approaches as x approaches a point from only the left side or only the right side.
One-sided limits appear graphically when evaluating each branch of a function separately, especially for piecewise-defined functions or graphs with jumps.
Reading One-Sided Limits from Graphs
The direction of approach matters:
Left-Hand Limits
To estimate a left-hand limit, consider only values of x less than the point of interest. Trace the graph moving rightward toward that point.
Key features to observe:
The y-values the graph gets close to as x increases toward the boundary
Whether the graph rises without bound, falls without bound, oscillates, or approaches a finite number
Right-Hand Limits
To estimate a right-hand limit, consider only values of x greater than the target point. Move leftward toward the x-value.
Important observations include:
Stabilization toward a y-value
Sharp turns or jumps
Vertical asymptotes affecting the approach behavior
If the left-hand and right-hand limits disagree, the two-sided limit fails to exist, but each one-sided limit may still exist individually.
Reading Two-Sided Limits from Graphs
A two-sided limit requires unity of behavior from both directions. When scanning the graph:
Check the left-hand and right-hand approach paths visually.
Identify whether both sides narrow toward the same y-value.
Note if the graph has a hole at the point; this does not affect the limit.
Observe discontinuities such as jumps or vertical asymptotes, which often signal the absence of a two-sided limit.
In smooth, continuous regions of the graph, two-sided limits typically match the function’s actual value, but this is not required for the limit to exist.
Key Visual Indicators of Limit Behavior
To ensure clarity when estimating graph-based limits, recognize these visual markers:
Indicators That a Limit Exists
The graph approaches the same horizontal level from both sides.
There is a hole at the point, but the curve consistently approaches a single y-value nearby.
The graph behaves predictably and without abrupt directional change near the point.
Indicators That a Limit Does Not Exist
Jump discontinuities, where the left- and right-hand limits differ.
Vertical asymptotes, where the graph increases or decreases without bound.
Oscillation, where the function values fluctuate and fail to settle near a single y-value.
Each of these conditions is identifiable directly through careful visual inspection.
Strategies for Accurate Estimation
To read limits reliably from graphs, use systematic observation:
Move your eyes along the curve from each side, noting the y-value approached.
Ignore the actual plotted point at the boundary; focus on nearby behavior.
Pay attention to scale, as steep slopes or compressed axes may distort perceived behavior.
When the graph is complex, check smaller and smaller neighborhoods around the point.
These strategies align with the AP expectation of using graphical evidence to determine one-sided and two-sided limits accurately and consistently.
Practice Questions
Question 1 (1–3 marks)
The graph of a function f is shown near x = 2. As x approaches 2 from the left, the graph approaches a y-value of 3. As x approaches 2 from the right, the graph approaches a y-value of 5.
(a) State the left-hand limit of f at x = 2.
(b) State the right-hand limit of f at x = 2.
(c) Determine whether the two-sided limit of f as x approaches 2 exists. Justify your answer.
Mark Scheme
(a) 1 mark: Correct left-hand limit stated as 3.
(b) 1 mark: Correct right-hand limit stated as 5.
(c) 1 mark: States that the two-sided limit does not exist because the left-hand and right-hand limits are not equal.
Question 2 (4–6 marks)
The graph of a function g is shown. As x approaches 4 from the left, g(x) approaches 1. As x approaches 4 from the right, g(x) approaches 1. The function has a hole at x = 4, and g(4) is defined to be 7.
(a) State the one-sided limits of g as x approaches 4.
(b) State the two-sided limit of g as x approaches 4.
(c) Is g continuous at x = 4? Explain your reasoning in terms of limits and the function’s defined value.
(d) Briefly describe how the graph illustrates the difference between a limit and a function value.
Mark Scheme
(a) 2 marks:
• 1 mark for correct left-hand limit: 1.
• 1 mark for correct right-hand limit: 1.
(b) 1 mark: Correct two-sided limit stated as 1.
(c) 2 marks:
• 1 mark for stating that g is not continuous at x = 4.
• 1 mark for correctly explaining that continuity fails because the function value g(4) = 7 does not equal the limit of the function, which is 1.
(d) 1 mark: Mentions that the graph shows the curve approaching 1 near x = 4, regardless of the hole, while the defined point at x = 4 is located at a different height, demonstrating that a limit describes nearby behaviour rather than the value at the point.
FAQ
A one-sided limit exists only if the function values settle towards a single number as x approaches the target from one direction.
If oscillations decrease in amplitude and tighten around a single y-value, the limit may exist.
If oscillations persist with no narrowing, the limit does not exist.
Check by visually “zooming in” on the region mentally:
• Oscillation narrowing → possible limit.
• Oscillation persisting → no one-sided limit.
A limit can exist even if the graph jumps or contains gaps, provided both sides approach the same y-value.
Key indicators include:
• Both branches leaning towards the same horizontal level.
• Open circles marking missing points but no change in approach behaviour.
• A separate isolated dot does not affect the limit.
Steep slopes compress significant vertical changes into a narrow horizontal region, making the approach behaviour harder to recognise.
To interpret such graphs reliably:
• Focus on direction of approach rather than the steepness.
• Look for whether the curve points towards a consistent y-value.
• If available, consider multiple scales or zoomed-in views.
Vertical scaling can exaggerate or flatten behaviour, making trends misleading.
A graph stretched vertically may appear to approach infinity, while one compressed vertically may hide unbounded growth.
To correct for scaling effects:
• Observe relative rather than absolute steepness.
• Look for arrowheads, asymptote markings, or levelling tendencies.
• Compare nearby y-values to judge whether they stabilise.
When several branches appear near the same x-value, concentrate on the one defined for the direction of approach.
Steps to clarify the limit:
• Identify the correct piece of the graph for the side you are analysing.
• Ignore branches defined for other intervals.
• Trace the chosen branch closely towards the target point, noting any levelling behaviour.
