
AP Syllabus focus:
‘Select an appropriate procedure for determining a limit, deciding when to use graphs, tables, direct substitution, algebraic manipulation, or the squeeze theorem.’
Choosing an appropriate limit-solving method requires recognizing structure, anticipating behavior, and selecting the most efficient representation; students must evaluate when numerical, graphical, or algebraic approaches provide the clearest insight.
Choosing Between Numerical, Graphical, and Algebraic Methods
The Purpose of Method Selection
Determining limits efficiently depends on selecting a method that best reveals nearby behavior of a function. Because limits describe what values a function approaches—not necessarily what it equals—students must identify which representation makes that behavior most visible and mathematically justified.
Understanding Nearby Behavior
A limit focuses on how a function behaves as approaches a specific value.
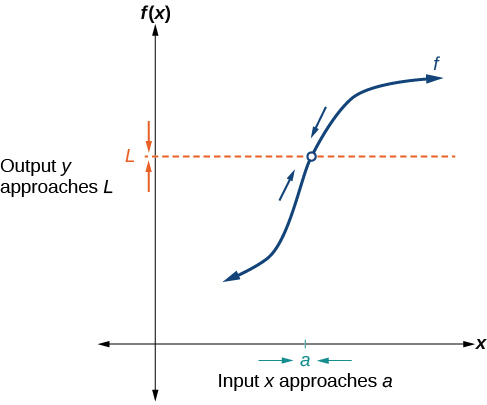
A smooth curve approaches the horizontal level L as the input nears a, illustrating the essential idea of a two-sided limit and emphasizing nearby behavior. Source.
The choice of method often depends on whether the function’s algebraic form is friendly to substitution, whether its graph indicates predictable behavior, or whether a table highlights trends that may otherwise be hidden.
What “Method Selection” Means
Choosing a method involves evaluating the structure of the function and determining which tool offers clarity with minimal unnecessary computation. This aligns closely with the need to model a function’s behavior near a point rather than at the point itself.
Limit Procedure: The strategic choice of numerical, graphical, or algebraic techniques used to determine the value a function approaches as nears a specific input.
A student who recognizes which method aligns with the function’s form can avoid missteps such as relying on substitution when the expression yields an indeterminate form or interpreting misleading graphical scales.
Numerical Methods (Tables)
When Numerical Approaches Are Useful
Numerical techniques rely on examining a table of values. Students choose this method when direct evaluation is difficult or when the function’s algebraic form obscures behavior near the point.
Use numerical methods when:
Function definitions are piecewise or complex.
Graphing is impractical or lacks precision.
Algebraic manipulation does not easily simplify the expression.
Investigating one-sided limits, where choosing x-values approaching from only one direction is necessary.
Strengths and Limitations
Numerical results reveal patterns such as convergence to a value or divergence toward infinity. However, rounding and calculator limits may create misleading impressions if numbers fluctuate due to small computational errors.
Graphical Methods (Visual Inspection)
When Graphical Techniques Are Appropriate
Graphical reasoning supports limit determination by showing the trend of y-values as x approaches a target. Graphs help students observe continuity, discontinuity, and asymptotic growth when algebra becomes cumbersome.
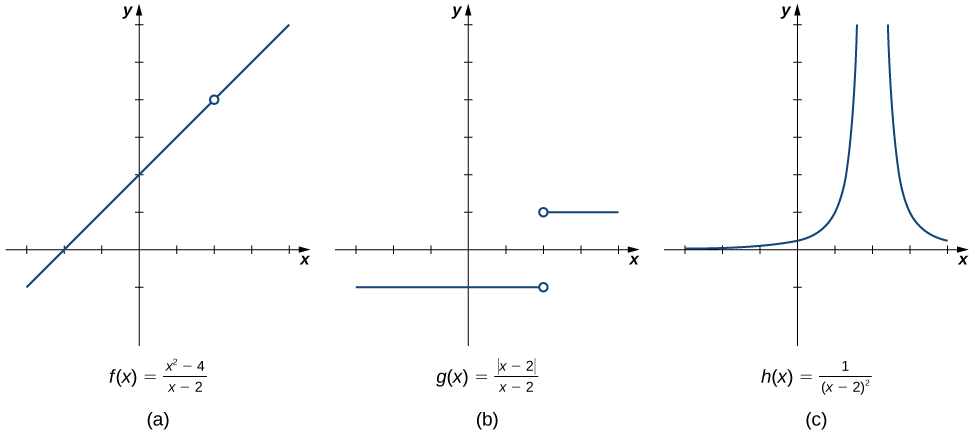
Three contrasting graphs compare a hole, a jump, and vertical blow-up near the same x-value, illustrating how different local behaviors affect the existence and evaluation of limits. Source.
Choose a graphical method when:
Observing overall shape or behavior is important.
Testing for the existence of two-sided limits.
The function’s formula is unavailable or too complex for quick manipulation.
Detecting oscillations, jumps, or vertical asymptotes.
Visual Caution
Graphs can hide small-scale behavior, especially when the axes are coarse or centered poorly. Limits inferred from incomplete graphs require verification via another method.
Algebraic Methods (Symbolic Manipulation)
When Algebraic Approaches Are Preferred
Algebraic reasoning allows exact conclusions using identities, simplification, and limit laws. Students select algebraic techniques when the expression structure allows simplification into a form where direct substitution produces a valid limit.
Common algebraic strategies include:
Direct substitution when the function is continuous at the point.
Factoring to eliminate removable discontinuities.
Rationalizing when radicals appear in numerator or denominator.
Limit laws to break down sums, products, and quotients.
Squeeze Theorem when bounding relationships are known and help justify the limit.
= Input value approached
= Function value when continuous
This equation reflects that algebraic substitution is valid only when the function is continuous at x = c; otherwise, manipulation or alternative procedures must be used.
When Algebra Fails
If substitution yields an indeterminate form such as 0/0, algebraic transformation is required. In other cases—such as oscillating functions or those without clear simplifications—numerical or graphical evidence may provide greater insight.
Building a Decision Process
Guiding Principles for Selecting a Method
Students benefit from having a structured mental checklist:
Identify structure
Determine whether the function is polynomial, rational, trigonometric, or piecewise. Structure influences which techniques are promising.Attempt direct substitution
If substitution gives a valid number, the limit is found. This is the quickest test of continuity at the point.Analyze for indeterminate forms
When substitution yields expressions such as 0/0, decide whether simplification (factoring, rationalizing) is feasible.Evaluate graphical behavior
If algebra becomes overwhelming or misleading, examine a graph to check trends, existence of one-sided limits, or asymptotic tendencies.Inspect numerical patterns
Check tables to observe value convergence and to confirm results from other representations. Use finer x-values to refine predictions.
Combining Representations
Often no single method provides full clarity. Numerical and graphical techniques can support algebraic work by reinforcing patterns and identifying misinterpretations.
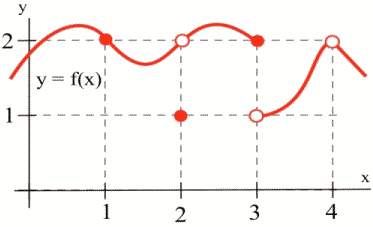
A graph paired with a numerical table demonstrates how visual and numerical evidence together help determine function behavior near a point and guide the selection of an effective limit-finding method. Source.
Likewise, algebraic reasoning offers the precision that graphs and tables lack.
The most effective strategy is to remain flexible, choosing the method—or combination of methods—that best clarifies the function’s behavior near the point of interest.
Practice Questions
Question 1 (1–3 marks)
A function f is shown on a graph near x = 2. The graph suggests that as x approaches 2, the y-values appear to stabilise around 3, although the point (2, 3) is not included on the graph.
Explain which method — numerical, graphical, or algebraic — would be most appropriate for determining the limit of f(x) as x approaches 2, and justify your choice.
Mark scheme:
• 1 mark for correctly identifying the graphical method as appropriate.
• 1 mark for stating that the graph directly shows the behaviour of f near x = 2.
• 1 mark for noting that the limit depends on nearby behaviour, not the function value at x = 2.
Question 2 (4–6 marks)
Consider the function g defined by an algebraic expression that produces the indeterminate form 0/0 when x = 4 is substituted.
A student suggests using a table of values to estimate the limit of g(x) as x approaches 4.
(a) State one advantage of using a numerical (tabular) method in this scenario.
(b) State one limitation of relying solely on numerical values from a table.
(c) Explain whether an algebraic method would be preferable, and justify your answer by referring to the structure of the expression.
(d) Describe how a graphical method could complement the numerical or algebraic approach in determining the limit.
Mark scheme:
(a)
• 1 mark for noting that a table allows examination of values close to 4 despite substitution giving 0/0.
(b)
• 1 mark for identifying a drawback such as rounding error, insufficient precision, or misleading patterns in coarse tables.
(c)
• 1 mark for recognising that algebraic manipulation (such as factoring or simplifying) can remove an indeterminate form.
• 1 mark for stating that this may give an exact limit rather than an estimate.
(d)
• 1 mark for explaining that a graph provides a visual trend near x = 4.
• 1 mark for noting that it can confirm whether the left and right behaviours agree, supporting or refining conclusions from other methods.
FAQ
Start with the structure of the expression. If the function appears continuous, try direct substitution since it is the quickest test.
If substitution fails or produces an indeterminate form, shift to algebraic manipulation. Reserve numerical and graphical methods for cases where the algebra becomes unmanageable or the given representation is incomplete.
Graphs reveal trends that are otherwise hidden within complicated algebraic expressions. Even if the symbolic form is messy, visual behaviour near a point can show whether values stabilise.
However, the apparent smoothness of a graph may be misleading if the scale is coarse, so graphical observations should be supported by another method when possible.
Numerical tables allow controlled, precise choice of values approaching a point from either side. This is helpful when a graph lacks resolution or when a function changes rapidly at small scales.
Tables also make it easier to detect subtle one-sided differences that a graph might smooth over.
If the function resembles one that is bounded by simpler expressions, recognising this structure may encourage checking algebraic relationships first.
Identifying possible bounding functions can also help determine whether numerical or graphical fluctuations are meaningful or merely reflect sampling limitations.
Check the assumptions of each method:
• Re-examine the graph for scaling issues or missing detail.
• Test whether the table values are fine enough to show true behaviour.
• Inspect the algebra for unremoved indeterminate forms or domain restrictions.
Conflicts often arise from representation limitations rather than genuine mathematical disagreement.
