
AP Syllabus focus:
‘Interpret the average rate of change of a function over an interval as the change in output divided by the change in input, relating this value to the problem’s real-world context.’
The average rate of change describes how a function’s output varies with its input over an interval, providing a bridge between algebraic expressions and meaningful real-world interpretations.
Understanding Average Rate of Change
The average rate of change measures how much a function’s output changes relative to its input over a specific interval. This value helps describe overall behavior without requiring information about how the function behaves at every point. It is particularly useful when interpreting data or understanding a scenario where only initial and final information are available.
Average Rate of Change: The change in a function’s output divided by the change in its input over an interval, often interpreted in a contextual or real-world setting.
Because this quantity compares total change rather than moment-to-moment change, it conveys a broad trend rather than instantaneous behavior. Students should recognize that while the concept originates from algebraic difference quotients, its interpretation depends heavily on context.
Formal Structure of the Average Rate of Change
To compute an average rate of change, one compares values of the function at two input points. This structure supports consistent interpretation across formulas, graphs, and real-world situations.
= Function outputs at the interval endpoints
= Input values defining the interval
This expression quantifies how much output changes per unit of input.
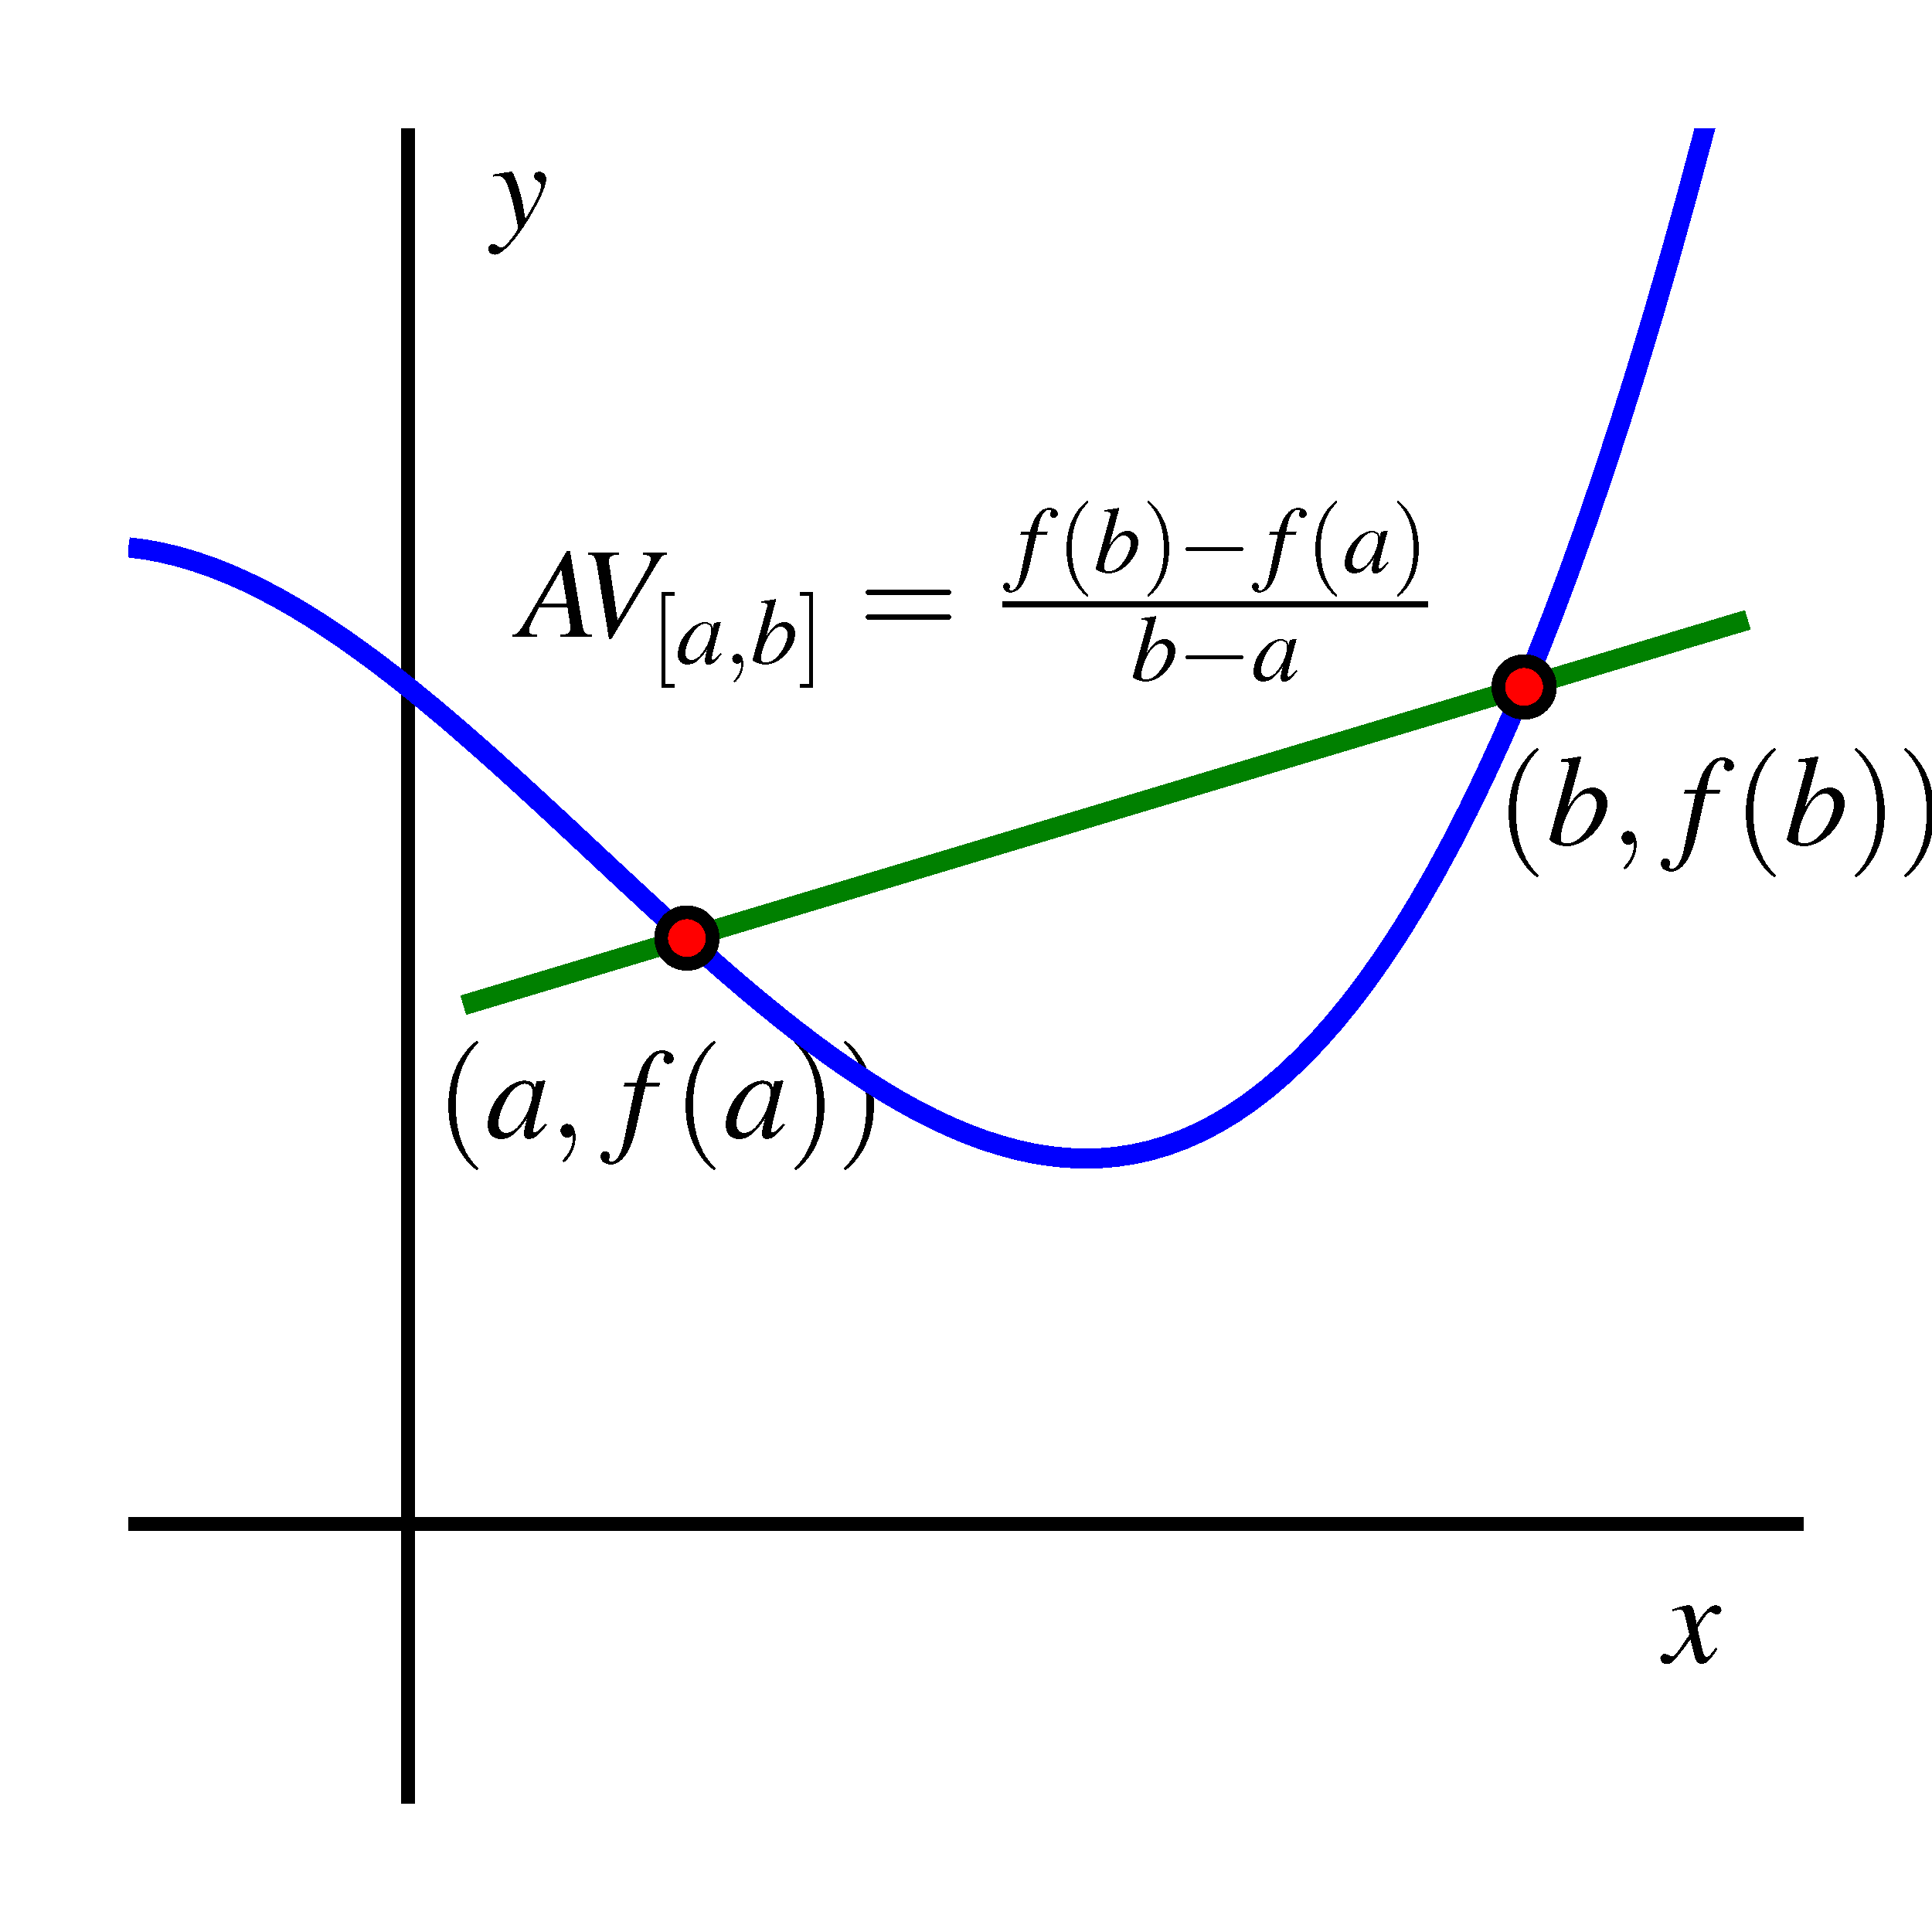
This figure shows a function with two highlighted points connected by a secant line. The slope represents the average rate of change on the interval. The diagram emphasizes how total output change relates to total input change. Source.
A vital aspect of using this structure is recognizing the relationship between signs and meaning. A positive average rate of change indicates increasing behavior over the interval, while a negative value indicates decreasing behavior. A value of zero reveals no net change across the interval.
Interpreting Average Rate of Change in Formulas
When a function is given by a formula, students can apply algebraic substitution to evaluate and directly. This procedure allows precise computation and creates a foundation for interpreting the meaning of the result within real-world contexts.
Key interpretive skills include:
Identifying the relevant interval based on the problem statement.
Recognizing units of both input and output to determine the units of the average rate of change.
Understanding how the magnitude of change communicates the strength of a relationship.
Relating the result back to the modeled situation using clear, descriptive language.
Because the average rate of change captures overall behavior, it should not be misinterpreted as describing behavior at individual points inside the interval. Instead, it communicates the overall trend between the starting and ending values.
Important Terminology for Formula-Based Interpretation
Students should be comfortable with several key terms that frequently appear in problems involving function formulas:
Interval: The pair of input values over which change is measured.
Net change: The total difference in output between the two input points.
Relative change: The output change compared to the input change, forming the essence of rate.
Units of rate: Derived by dividing output units by input units, essential for correct contextual interpretation.
Each of these terms reinforces that average rate of change is fundamentally tied to how one quantity responds to changes in another.
Interpreting Average Rate of Change in Context
Real-world problems demand not only correct computation but also clear explanation of the meaning of the average rate of change. Typical contexts—such as motion, economics, population growth, or scientific measurement—rely on understanding what the function represents and how the interval selection affects interpretation.
To support meaningful interpretation in context, students should:
Identify what the input represents in the scenario.
Identify what the output represents in the scenario.
State the rate using appropriate units from the context.
Describe the average rate of change in words that match the real-world meaning of the function.
For instance, if input measures time and output measures distance, the resulting average rate of change carries the units of distance per time, describing overall speed over the interval.
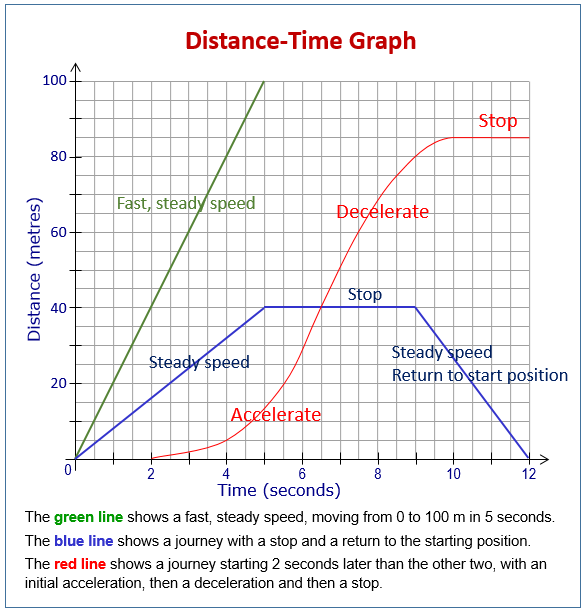
This graph illustrates how distance changes over time for different motion patterns. The slope of any segment, interpreted as , corresponds to an average speed. Additional labels such as “Accelerate” and “Steady speed” extend beyond the syllabus but help visualize varying rates of change. Source.
Common Interpretive Pitfalls
Students should avoid several misinterpretations that can distort the meaning of the average rate of change:
Confusing average rate of change with instantaneous rate of change.
Ignoring the context’s units when expressing the rate.
Assuming behavior between the endpoints is uniform.
Using interval endpoints incorrectly or reversing and in ways that alter sign and meaning.
Understanding these pitfalls ensures clearer communication and more accurate interpretation in applied settings.
Process for Interpreting and Communicating the Average Rate of Change
The following structure supports reliable interpretation across a wide variety of contexts:
Identify the interval of interest based on the problem statement.
Compute the net change in output and net change in input.
Calculate the average rate of change using the difference quotient.
Determine units by dividing output units by input units.
Interpret the meaning of the computed value in complete sentences tied to the real-world situation.
This stepwise approach reinforces the connection between symbolic procedures and contextual understanding, fulfilling the syllabus requirement that students interpret average rates of change meaningfully across both formulas and real-world scenarios.
Practice Questions
A function g is defined on the interval 2 ≤ x ≤ 6. The values g(2) = 5 and g(6) = 17 are known.
(a) Find the average rate of change of g over this interval.
(1–3 marks)
(a)
Correct use of difference quotient: (17 − 5) / (6 − 2) (1 mark)
Correct evaluation to 3 (1 mark)
Maximum: 2 marks
A population P of a species is modelled by a differentiable function over time t in years. The values are:
P(1) = 1200, P(4) = 1950, P(7) = 2550.
(a) Find the average rate of change of the population between t = 1 and t = 7.
(b) Explain, in context, what your answer in part (a) means.
(c) Determine whether the average rate of change over t = 1 to t = 4 is greater or less than the average rate of change over t = 4 to t = 7, showing working.
(4–6 marks)
(a)
Correct use of difference quotient: (2550 − 1200) / (7 − 1) (1 mark)
Correct evaluation to 225 (1 mark)
(b)
Clear contextual interpretation: population increases on average by 225 individuals per year over the interval t = 1 to t = 7 (1 mark)
(c)
Correct calculation for t = 1 to t = 4: (1950 − 1200) / 3 = 250 (1 mark)
Correct calculation for t = 4 to t = 7: (2550 − 1950) / 3 = 200 (1 mark)
Correct comparative statement: the average rate of change is greater on the interval 1 to 4 than on 4 to 7 (1 mark)
Maximum: 6 marks
FAQ
As the interval gets shorter, the average rate of change becomes more sensitive to local behaviour of the function. Small variations in output can cause larger swings in the computed rate.
If the function is smooth, the values tend to approach the instantaneous rate of change, but this subsubtopic focuses only on finite intervals, not limits.
This indicates that the ratio of total output change to total input change is the same on both intervals, even if the function behaves differently within them.
It does not imply that the function is linear, but it does mirror the behaviour of linear functions in which all secant slopes are identical.
Not directly. The value reflects only the overall trend between the endpoints of an interval.
However, using multiple adjacent intervals can hint at changes in behaviour:
A shift from positive to negative average rates suggests a reversal in trend.
Large differences in adjacent average rates may indicate curvature or turning points.
Units must always combine the output unit with the input unit, forming a compound measure such as metres per second or cost per item.
Consistency matters:
Use the exact units stated in the context.
Avoid rounding units or replacing them with informal equivalents.
Clear unit communication strengthens the interpretation of rates.
A clear verbal description states:
How much the output quantity changes
For each unit of the input quantity
Over the specified interval
For example: “The temperature increased on average by 1.2 degrees per hour over the time period.” This phrasing links the mathematical ratio to a real situation, emphasising trend rather than instantaneous change.
