
AP Syllabus focus: ‘Elemental analysis can determine the relative numbers of atoms in a substance and can be used to assess whether a sample is pure or part of a mixture.’
Elemental analysis links measurable mass data to atomic-level composition.
A CHN(S/O) elemental analyzer (combustion-based) measures the amounts of elements like C, H, and N in a sample and reports results as mass percentages. Those measured mass percentages are the experimental inputs you compare to theoretical composition when evaluating whether a sample is consistent with a single pure compound. Source
In AP Chemistry, it is mainly used to test whether a sample’s elemental makeup matches a claimed pure substance or indicates contamination or mixing.
Core idea: using composition to judge purity
Elemental analysis compares an experimentally measured elemental composition to the composition predicted by a chemical formula. A pure substance shows a consistent, characteristic elemental makeup; a mixture can show shifted or inconsistent composition because it contains more than one type of particle.
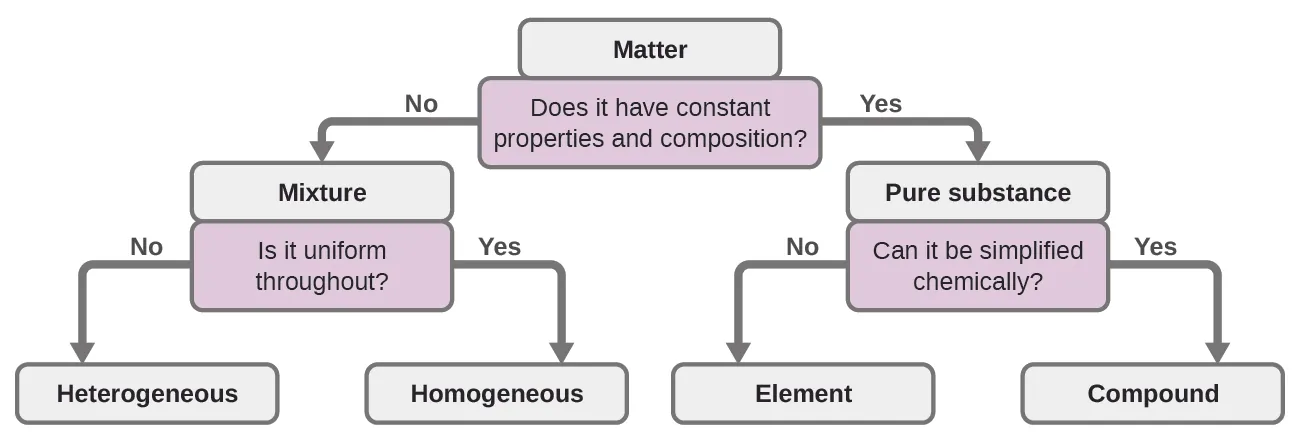
Flowchart for classifying matter using whether composition/properties are constant, highlighting the core distinction between pure substances and mixtures. In the context of elemental analysis, the question “constant composition?” aligns with whether measured mass percentages match a single, fixed formula versus reflecting mixed components. Source
What “elemental analysis” means in AP Chemistry
Elemental analysis — an experimental determination of the amounts (often mass percentages) of each element present in a sample, used to infer atomic ratios and evaluate identity or purity.
Elemental analysis data are commonly reported as mass percent of each element (e.g., %C, %H, %N), which can be converted into relative atom counts by converting each element’s mass contribution to moles.
The “purity” question elemental analysis can answer
Elemental analysis supports purity claims by checking whether measured composition aligns with what a single compound must contain.
If the sample is pure and correctly identified, measured element percentages should be close to theoretical values (within reasonable experimental error).
If the sample is a mixture or impure, results often show:
an element present that should not be there (e.g., measured %N in a nitrogen-free compound)
element percentages that systematically deviate from theoretical values
trial-to-trial inconsistency because the mixture is not uniform at the particle level
Quantifying composition comparisons
To compare experimental and theoretical compositions, students typically rely on mass percent relationships.
= mass of a given element present (g)
= total mass of the sample analysed (g)
This comparison is usually paired with a mole-ratio check: convert each element’s mass (or mass percent) to moles, then compare mole ratios to the expected atomic ratios for a claimed formula.
How elemental analysis reveals mixtures vs pure substances
“Fingerprint” logic: one formula, one composition
A single compound has a fixed elemental composition. Therefore, if a sample’s measured composition cannot plausibly arise from a single formula (or fails to match the claimed formula), that is evidence the sample is not purely that compound.
Common mixture/impurity patterns seen in composition data
Dilution by an inert contaminant: all measured element mass percentages for the compound decrease together because part of the sample mass is something else (e.g., sand, salt, metal).
Added water or solvent: %H (and often %O, if oxygen is tracked) can be elevated; other elements’ percentages drop.
Mixture of two related compounds: the same elements may be present but in shifted proportions (e.g., two hydrocarbons with different C:H ratios).
Non-uniform mixture: replicate analyses differ beyond expected measurement variation.
Using multiple elements strengthens the purity claim
Matching a single element percentage is weak evidence; different compounds can share similar % values for one element. Matching several element percentages simultaneously (e.g., %C, %H, and %N) provides stronger support that one compound dominates the sample.
Purity statements and what they mean operationally
In practice, “purity” depends on context: a sample can be mostly one compound but still contain minor impurities. Elemental analysis helps estimate whether the bulk composition is consistent with one component.
Converting composition agreement into a “percent purity” estimate
When an impurity contributes mass but not the target element(s), the measured mass percent of a chosen element can be used to estimate how much of the sample is actually the desired compound (conceptually, “how much of the mass behaves like the target’s formula”).
= measured mass percent for a diagnostic element
= mass percent predicted by the claimed pure compound
This approach is most defensible when the impurity does not contain that diagnostic element and when measurement error is considered.
Good practice when interpreting elemental analysis
Check whether all reported elements are chemically reasonable for the claimed identity.
Compare several element percentages, not just one.
Use replicate results to judge consistency (pure substances tend to give reproducible composition).
Treat small deviations cautiously; analytical uncertainty and sample handling can produce minor shifts.
Practice Questions
(2 marks) Explain how elemental analysis data can be used to decide whether a sample is pure or part of a mixture.
States that elemental analysis gives the proportions (e.g., mass percentages) of elements in the sample (1).
Explains that a pure compound has a fixed composition, so agreement with theoretical values suggests purity, whereas disagreement/extra elements/inconsistent results suggest a mixture or impurity (1).
(6 marks) A compound is claimed to be pure caffeine, . Theoretical nitrogen mass percent is . Elemental analysis of the sample gives nitrogen. Assume the impurity contains no nitrogen. (a) Calculate the percentage purity of caffeine in the sample. (3 marks) (b) State two limitations or assumptions in using this method to assess purity. (3 marks)
Uses relationship (1)
Correct numerical working shown (1)
Correct answer: (accept –) (1) (b) Any two, 1 mark each plus one for explanation/clarity (3 total), e.g.:
Assumes impurity contains no nitrogen; if it does, purity is overestimated (1)
Assumes sample is homogeneous; non-uniform mixing affects measured %N (1)
Analytical/experimental error in elemental analysis affects result (1)
Assumes correct identity of the main component (if not caffeine, comparison is invalid) (1)
FAQ
Common approaches include combustion-based methods (for C, H, N) and instrument-based methods such as ICP (for many metals).
They measure masses (or signals proportional to amounts) of elements, which are converted into mass percentages for the original sample.
Oxygen can be difficult to quantify directly in some routine workflows, so it may be reported “by difference”.
That means $ %O = 100% - (%C+%H+%N+\ldots)$, which compounds uncertainties from the other measured elements.
It can’t uniquely identify components by itself if both compounds contain identical elements.
It can, however, show that the overall element ratios are inconsistent with any single claimed formula, suggesting a mixture even when the element list matches.
Impurities that contribute the same elements in similar proportions can be hard to detect. Examples include:
structurally different organics with similar C:H:N ratios
closely related compounds where elemental percentages differ only slightly
Other methods (e.g., chromatography) may be needed.
Moisture uptake, residual solvent, or incomplete drying can change measured mass percentages, often lowering %C and raising apparent %H (and sometimes %O by difference).
Poor mixing or particle segregation can cause different subsamples to give different compositions, mimicking impurity.
