
AP Syllabus focus: ‘In a PES spectrum, peak position indicates how strongly electrons are held, and peak height is ideally proportional to the number of electrons in that subshell.’
Photoelectron spectroscopy (PES) produces spectra that encode electron energies. To read a PES spectrum well, focus on two ideas: binding energy (peak position) and electron count (peak height/area).
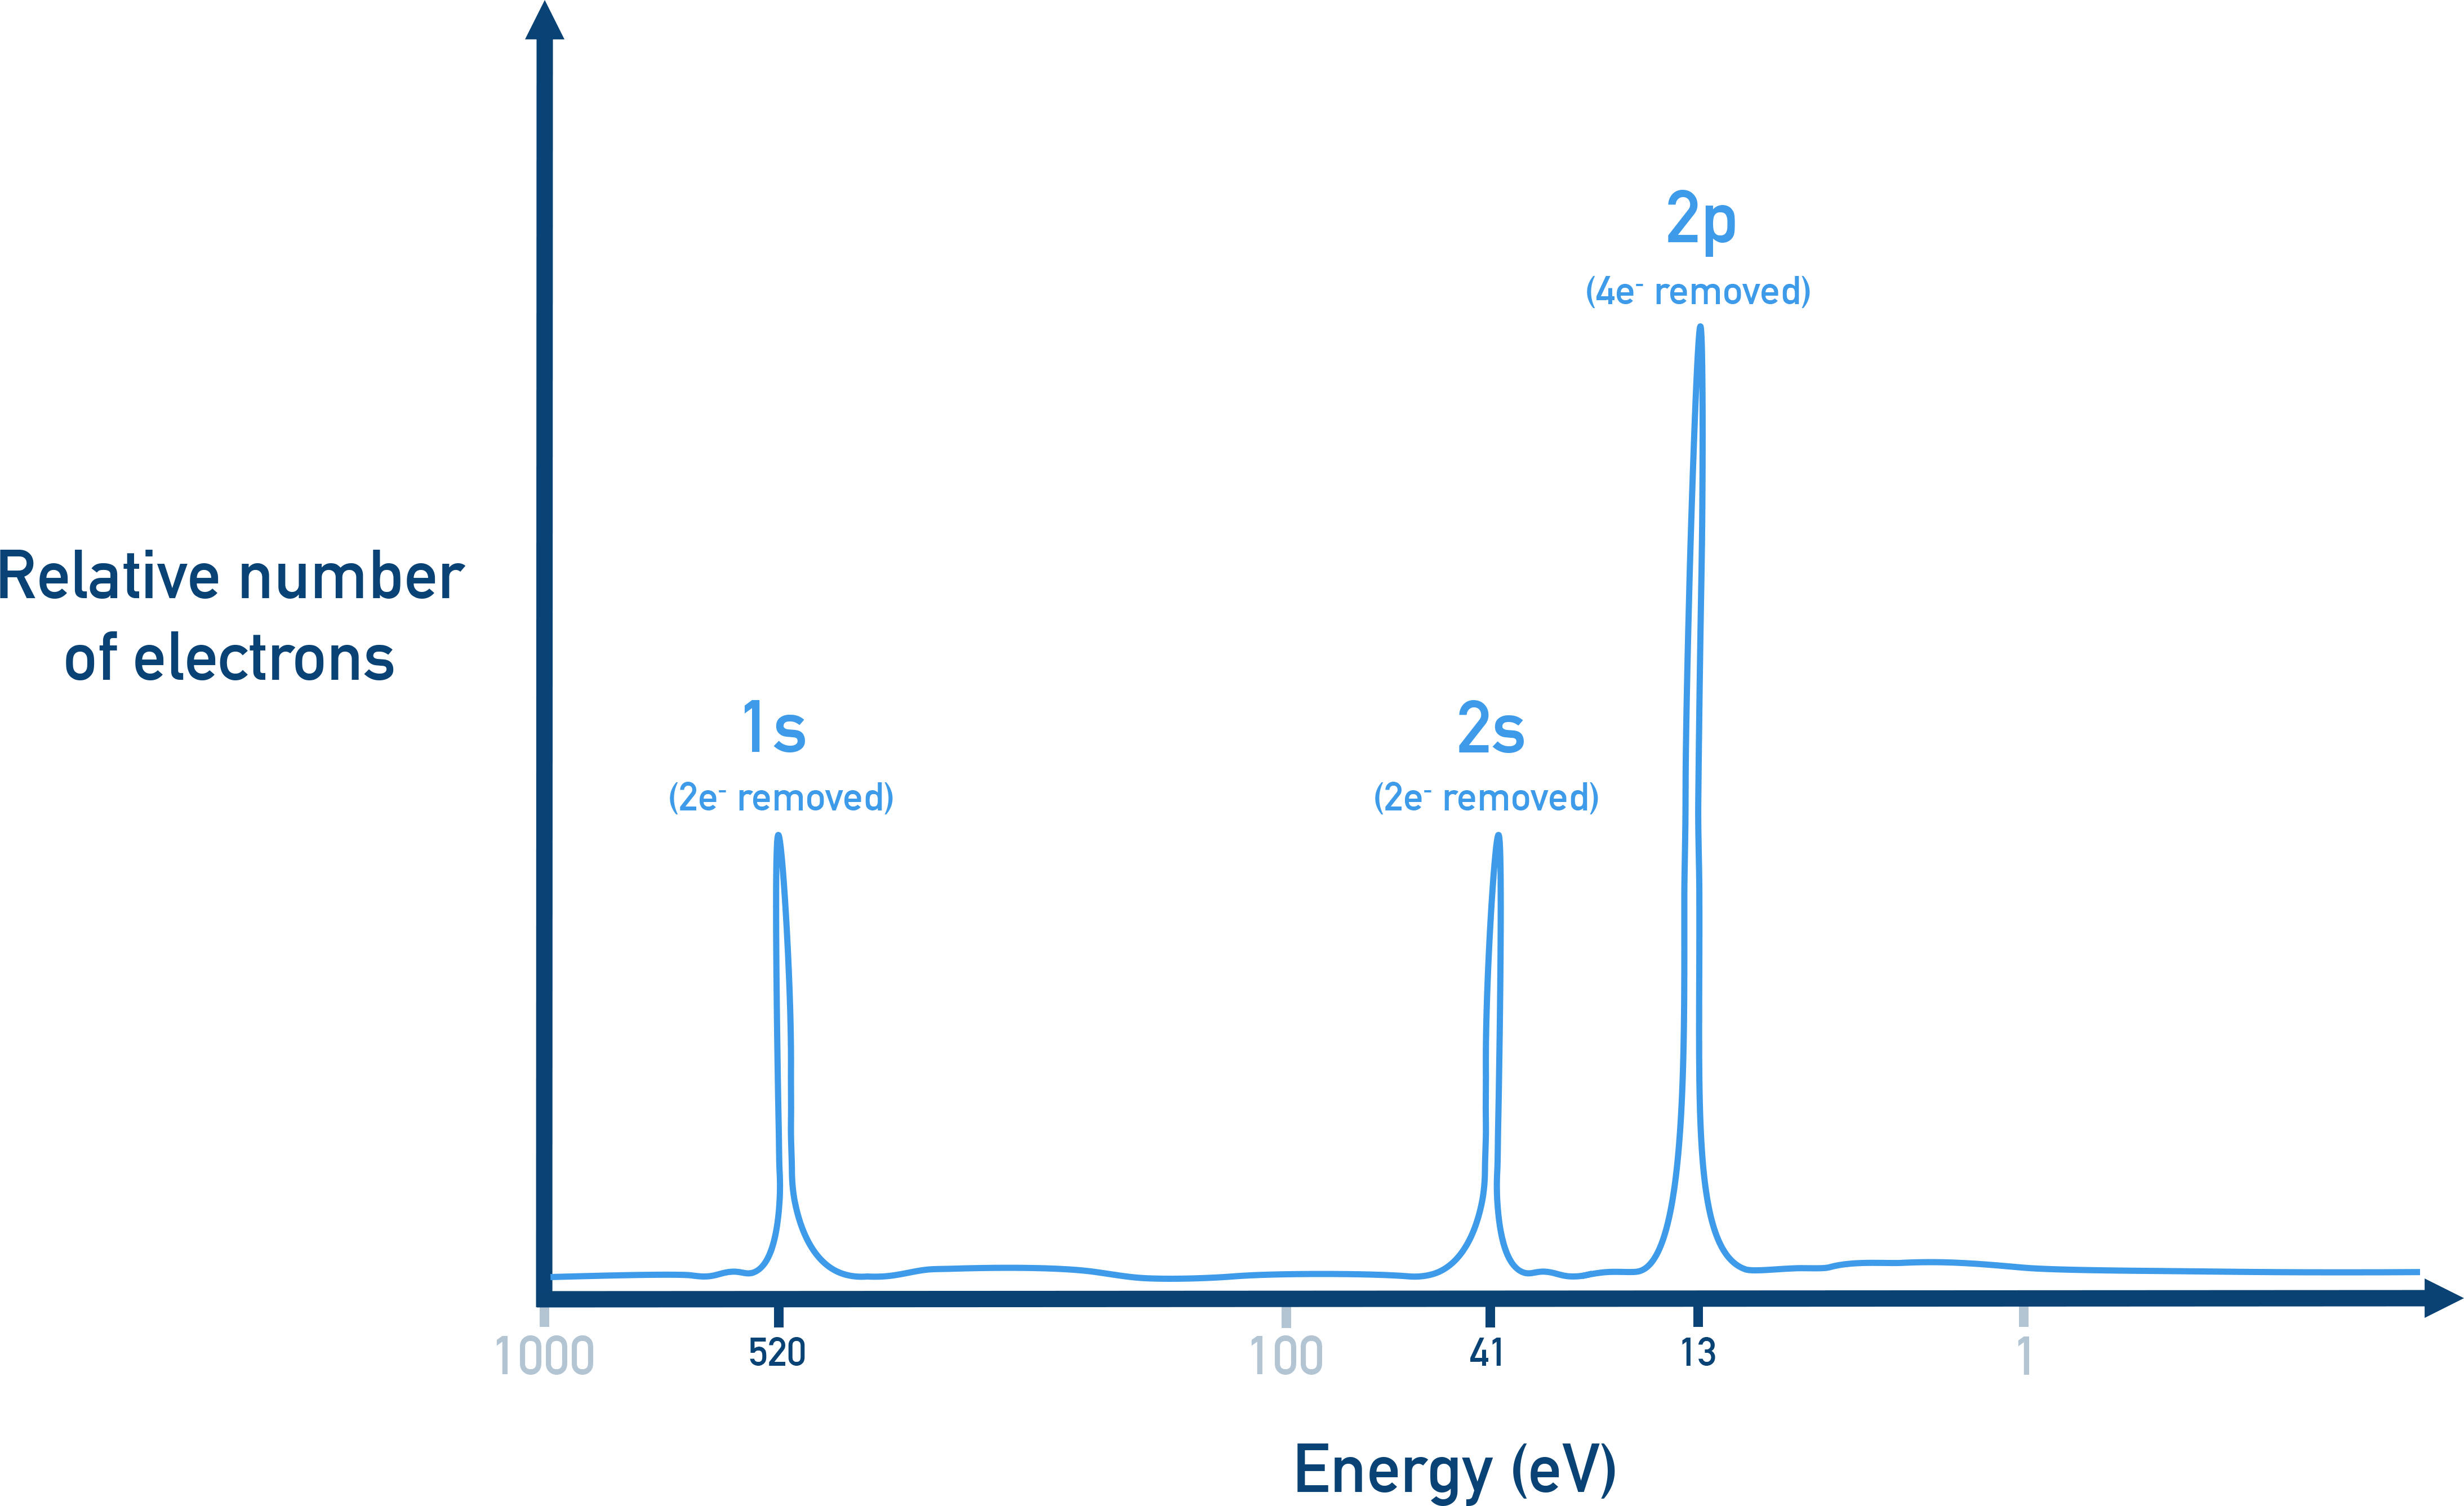
Example photoelectron spectroscopy (PES) spectrum with labeled subshell peaks (1s, 2s, 2p). The horizontal placement of each peak represents the relative binding energy of electrons in that subshell, while the peak height indicates the relative number of electrons contributing to that signal. Source
Peak position: binding energy (how strongly electrons are held)
In PES, each peak corresponds to electrons removed from a particular subshell (a set of orbitals of the same type within a shell, such as s or p). The horizontal location of a peak reports the binding energy for that set of electrons.
Binding energy (BE): The energy required to remove an electron from a gaseous species; a larger BE means the electron is held more strongly.
Interpreting “more” vs “less” binding energy
Higher binding energy peak (often plotted farther left on AP-style graphs) means:
more energy needed to remove the electron
electrons are more strongly held
Lower binding energy peak means:
less energy needed to remove the electron
electrons are less strongly held
Because PES plots are not always formatted identically, always check the axis label and direction before comparing peaks.
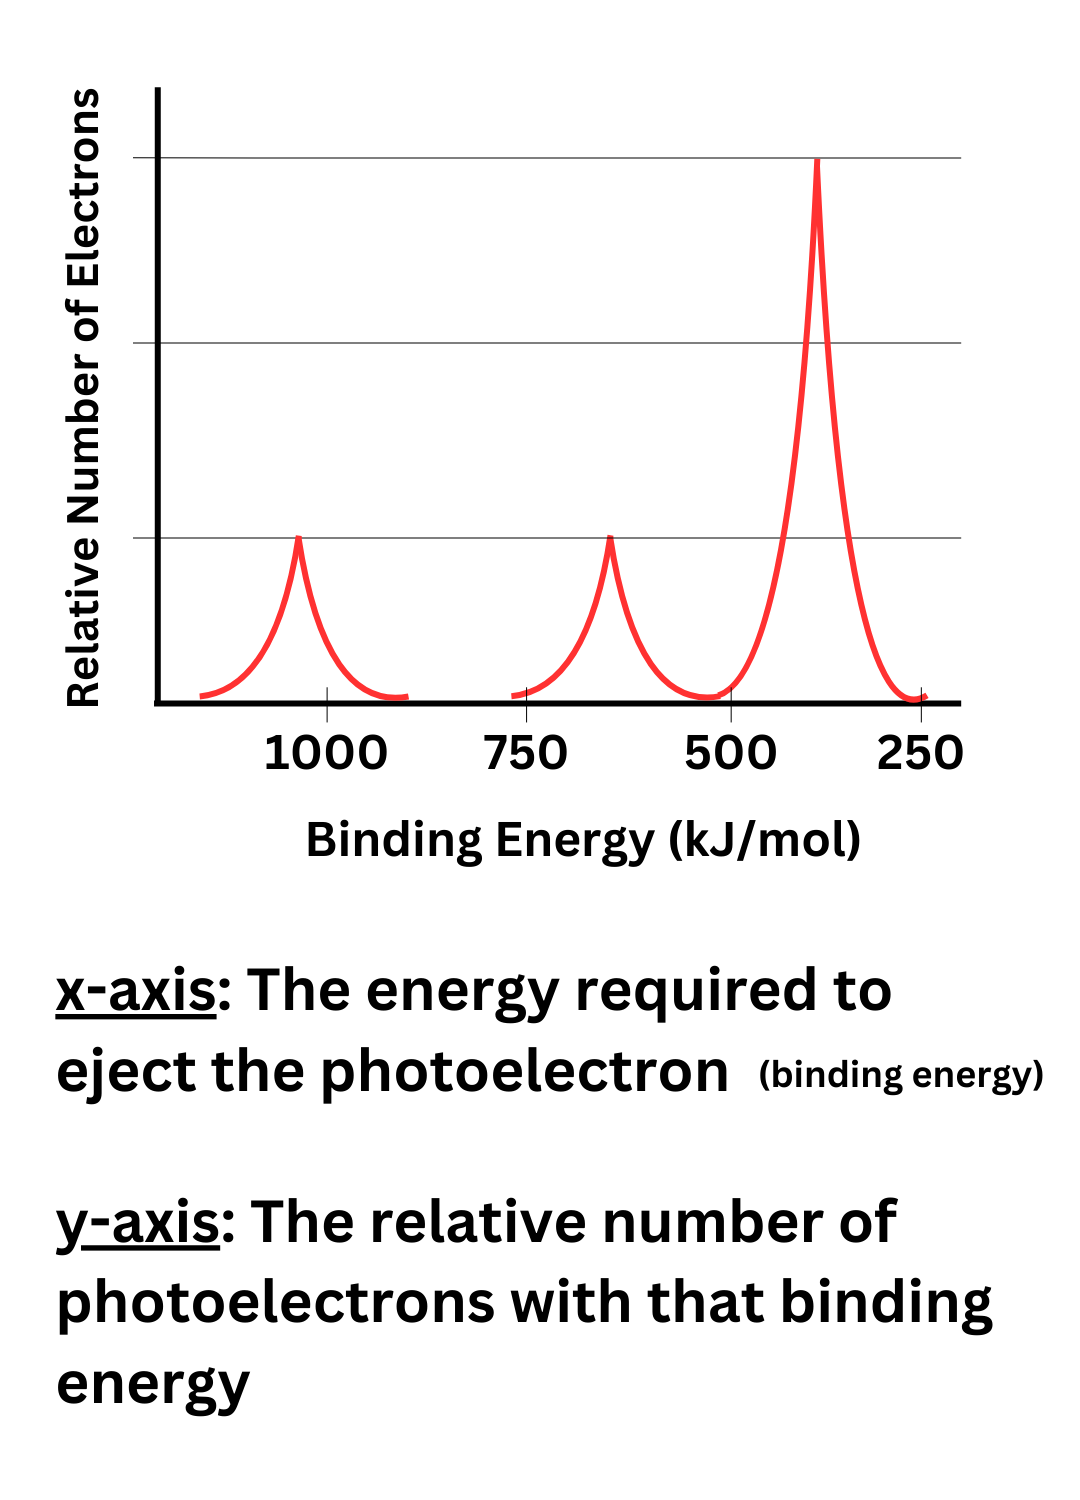
PES-style spectrum highlighting axis meaning: the x-axis is binding energy (energy required to eject an electron) and the y-axis is relative number of detected electrons. This is a useful visual reminder that “higher binding energy” is determined by the axis direction, and that peak size is used as a proportional electron-count indicator. Source
If the axis is labeled Binding Energy (eV) and values increase to the left, then “left = higher BE.”
If values increase to the right, then “right = higher BE.”
Energy relationship behind the peak position
PES determines binding energy from the measured kinetic energy of the ejected electron and the photon energy used to eject it.
= photon energy (J or eV)
= binding energy (J or eV)
= kinetic energy of the ejected electron (J or eV)
A peak at larger corresponds to electrons that emerge with smaller for the same .
Peak height (or area): electron count in a subshell
The vertical size of a peak indicates how many electrons contributed to that signal. In an idealised PES spectrum, peak height is proportional to the number of electrons in that subshell.
What “proportional” means on AP-style spectra
When comparing peak heights (or, more accurately, peak areas):
A peak representing 2 electrons should be about twice the signal of a peak representing 1 electron.
Common expected electron counts per subshell (maximum capacities) are:
s subshell: up to 2 electrons
p subshell: up to 6 electrons
(Less commonly tested for counting from peak size: d = 10, f = 14)
Thus, if two peaks are labelled as coming from an s and a p subshell in the same shell, an ideal height ratio could be near 1:3 (2 vs 6 electrons), assuming both are filled.
Practical cautions when using peak size
PES peak heights are described as “ideally proportional” because real spectra can deviate due to experimental factors. For AP Chemistry reading tasks, you should:
treat peak size as a relative electron-count indicator, not a perfectly exact measurement
use simple ratios (e.g., 1:1, 1:2, 1:3, 3:5) when the graph is clearly drawn to support them
avoid over-interpreting small differences unless the spectrum clearly shows distinct proportionality
Putting position and height together (reading a spectrum efficiently)
A reliable read of PES peaks combines both axes at once:
Use peak position to rank electrons by how strongly they are held (higher BE = stronger hold).
Use peak height/area to infer how many electrons are in that subshell.
Treat each peak as one subshell’s electrons; multiple peaks indicate multiple subshell groups with different binding energies.
When asked to justify, explicitly reference the spectrum:
“Peak A has higher binding energy, so those electrons are more strongly held.”
“Peak B is about three times taller, indicating about three times as many electrons in that subshell.”
Practice Questions
(2 marks) A PES spectrum shows Peak X at higher binding energy than Peak Y. What does this indicate about the electrons in X compared with Y?
1 mark: electrons in X are more strongly held / require more energy to remove. 1 mark: X has higher binding energy than Y (explicit comparison).
(5 marks) A PES spectrum has three peaks A, B, C with relative heights 2:6:2. Peak A is at the highest binding energy, B is intermediate, C is lowest. Explain what the peak heights indicate and what the binding energy order indicates.
2 marks: heights 2:6:2 imply electron counts proportional (2, 6, 2) in three subshells. 1 mark: identify that 6 corresponds to a p subshell capacity (or “three times an s peak”). 2 marks: binding energy order A > B > C means A electrons most strongly held, C least strongly held.
FAQ
Area captures total signal when peaks have different widths; height alone can mislead if peaks are broadened.
No. Many do, but some increase to the right. Always read the axis numbers and label before interpreting “higher” binding energy.
Yes. Close binding energies can occur; resolution limits may make peaks appear closer or partially overlap.
Usually electronvolts, $eV$. Sometimes relative scales are shown; the interpretation (higher vs lower) is the key idea.
Instrument response, background subtraction, and differing detection efficiencies can distort heights, so AP questions typically use clear, idealised ratios.
