
AP Syllabus focus: ‘Use PES patterns to relate peaks to a species’ ground-state electron configuration and to infer interactions between electrons and the nucleus.’
Photoelectron spectroscopy (PES) turns electron removal energies into a visual pattern of peaks. This pattern can be mapped onto subshells in a ground-state electron configuration and used to compare nuclear attraction across species.
Connecting PES Peaks to Ground-State Electron Configuration
What a peak “means” in configuration language
In PES, each peak corresponds to electrons being removed from a particular subshell (such as 1s, 2s, 2p). Connecting a spectrum to an electron configuration relies on two linked ideas:
Peak position (binding energy): which subshell the electrons came from, and how strongly the nucleus holds them
Peak intensity (relative area/height): how many electrons occupy that subshell in the ground state
Higher binding energy electrons are generally core electrons (closer to the nucleus), while lower binding energy electrons are typically valence electrons (farther from the nucleus).
Binding energy: the energy required to remove an electron from a specific subshell of a gaseous atom or ion.
PES binding energies are commonly shown so that more strongly held electrons appear at higher binding energy, making inner-shell peaks easy to distinguish from outer-shell peaks.
The key relationship used by PES instruments
A PES instrument measures the kinetic energy of ejected electrons and converts that to binding energy.

Graph of maximum photoelectron kinetic energy versus incident light frequency shows a threshold frequency and a linear region consistent with . In PES, this relationship underpins the conversion from measured electron kinetic energy to binding energy when the photon energy is known. Source
= binding energy of the electron (typically reported in )
= photon energy supplied by the radiation source ()
= measured kinetic energy of the ejected electron ()
This relationship supports a core AP skill: interpreting a change in peak position as a change in how strongly electrons are attracted to the nucleus.
Mapping peak patterns to subshell filling
To connect peaks to a ground-state electron configuration, look for these PES pattern features:
Number of peaks: indicates how many subshells contain electrons
Relative peak sizes: track subshell electron counts (e.g., s holds 2, p holds 6)
Grouping by shell (n):
Peaks for n = 1 electrons appear at much higher binding energy than n = 2, and so on
Within the same shell: electrons in an s subshell are typically at higher binding energy than electrons in a p subshell of the same n, because s electrons penetrate closer to the nucleus and experience stronger attraction
Thus, a spectrum with peaks consistent with 1s, 2s, and 2p occupancy can be directly translated into a configuration like , with the value of inferred from the p-peak intensity.
Using PES to Infer Electron–Nucleus Interactions
What shifts in binding energy imply
PES is not just “counting electrons”; it also reveals changes in nuclear attraction. For electrons in the same type of subshell, a higher binding energy indicates they are held more tightly by the nucleus. Conceptually, that tighter hold can arise from:
Greater nuclear charge (more protons)
Less electron shielding (reduced screening by other electrons)
Greater penetration (electron density closer to the nucleus)
These effects are inferred qualitatively by comparing spectra, especially for related species.
Comparing different elements (same subshell labels)
When comparing PES spectra across a period, peaks associated with the same subshell label (such as 2p) generally shift to higher binding energy as atomic number increases, because the nucleus attracts electrons more strongly. This supports connecting periodic trends to a physical cause: increased electron–nucleus attraction.
The comparison is strongest when you:
Compare corresponding subshell peaks (e.g., 2p vs 2p)
Interpret systematic peak shifts as changes in attraction rather than changes in electron count
Comparing ions and atoms of the same element
PES also helps distinguish between an atom and its cation:
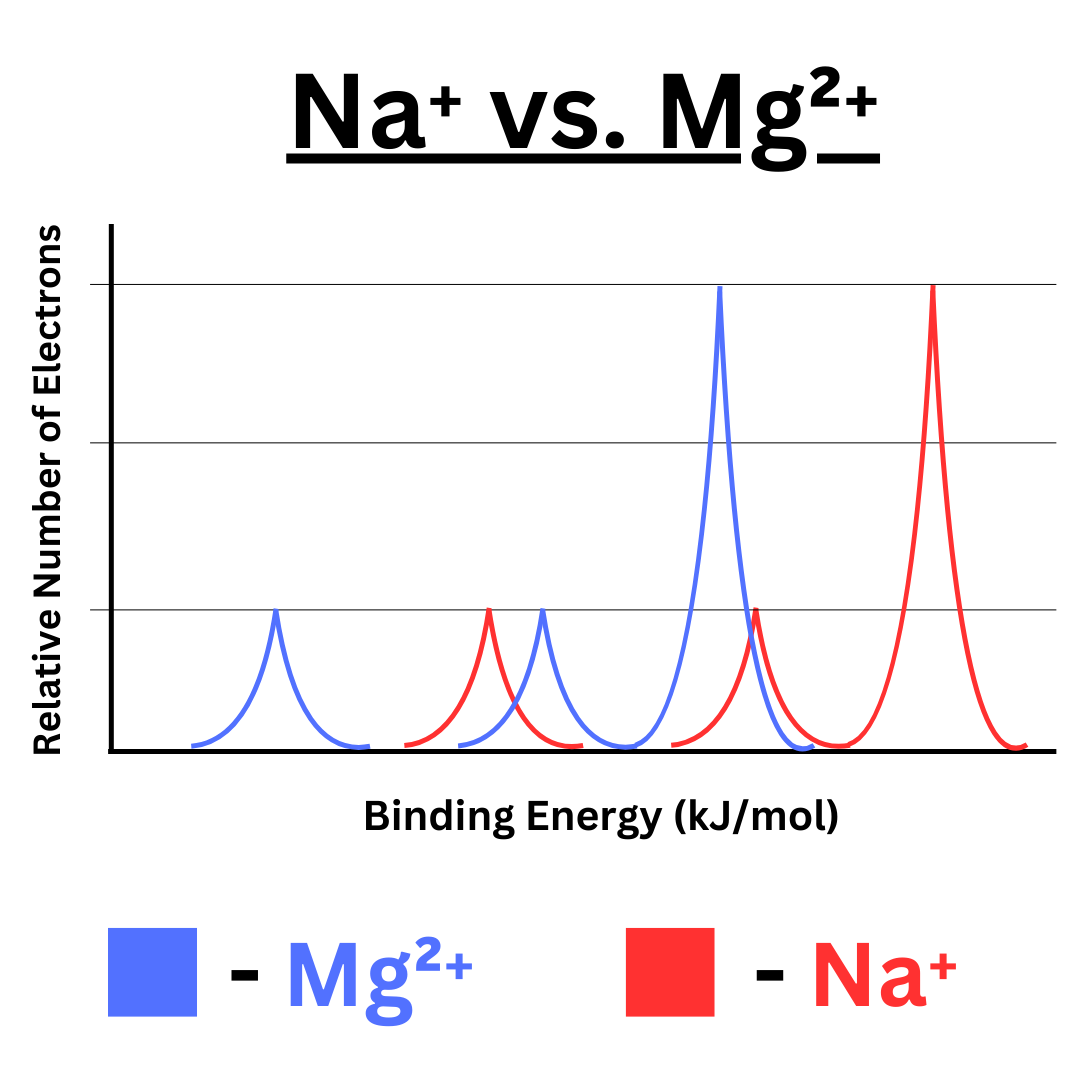
Overlayed PES-style spectra for two isoelectronic cations ( and ) illustrate how increased nuclear charge shifts corresponding subshell peaks to higher binding energy. Because the electron counts are the same, the peak pattern (subshell occupancy) stays similar while peak positions move, isolating the effect of stronger electron–nucleus attraction. Source
Forming a cation reduces electron–electron repulsion and often reduces shielding for remaining electrons
Remaining electrons experience stronger attraction to the same nucleus, so many peaks shift to higher binding energy
The valence-region of the spectrum changes to reflect the new ground-state electron configuration (fewer electrons in the outer subshells)
Interpreting both the change in peak intensities (configuration change) and the direction of peak shifts (attraction change) is the central “connection” skill in this subsubtopic.
Practice Questions
A PES spectrum has three peaks. Their relative intensities are consistent with 2 electrons, 2 electrons, and 6 electrons (from highest to lowest binding energy). Identify the ground-state electron configuration represented.
identified (1)
identified (1)
identified (1)
The PES spectrum of species X has a valence-region peak corresponding to a 3s subshell. When X is converted to X, the 3s peak becomes smaller and shifts to higher binding energy. Explain both observations in terms of electron configuration and electron–nucleus interactions.
Smaller peak linked to fewer electrons in the 3s subshell in X (1)
Statement that forming X involves removal of an electron from the outer (valence) level (1)
Higher binding energy linked to stronger attraction between remaining electrons and the nucleus (1)
Reduced shielding and/or reduced electron–electron repulsion stated as a cause of increased attraction (1)
Clear link between increased attraction and increased energy required to remove an electron (1)
FAQ
Peak width can reflect instrumental resolution and multiple closely spaced electron environments.
It can also arise from short lifetimes of core-hole states, which increases energy uncertainty.
Real spectra are affected by detector sensitivity and the probability of ejection from different subshells.
Background subtraction and overlap between nearby peaks can also distort apparent heights.
2s electrons penetrate closer to the nucleus than 2p electrons.
That greater penetration increases nuclear attraction, so 2s electrons typically have higher binding energy than 2p electrons within the same shell.
A chemical shift is a small change in binding energy caused by different bonding environments.
Electronegative atoms can withdraw electron density, increasing binding energy for certain electrons on an atom within a molecule.
The photon energy sets the maximum binding energies that can be probed and influences measured kinetic energies.
Different photon energies can also change relative signal strengths and surface sensitivity, affecting how clearly peaks are resolved.
