
Photoelectron spectroscopy (PES) is a precise technique used to analyze the energy levels of electrons in atoms, aiding in the identification of electron configurations and atomic structure.
The Structure of the Atom
To fully understand PES, we must begin with the fundamental components of the atom:
Protons are subatomic particles with a +1 charge, located in the nucleus of the atom. Each proton has a mass of approximately 1 atomic mass unit (amu).
Neutrons also reside in the nucleus and have no charge. Like protons, they have a mass close to 1 amu.
Electrons are negatively charged (-1) particles that orbit the nucleus in regions called orbitals. Unlike protons and neutrons, electrons have an almost negligible mass and are involved in chemical reactions and bonding.

Electrons exist in various energy levels or shells, which are further divided into subshells (s, p, d, f). These regions are not rigid paths but probability clouds that describe where an electron is most likely to be found.
The Quantum-Mechanical Model of the Atom
Earlier atomic models, such as Bohr’s model, treated electrons like planets orbiting the nucleus in fixed paths. While useful for simple atoms, this model does not accurately describe electron behavior in more complex atoms.

Image Courtesy of dreamstime
Modern chemistry relies on the quantum-mechanical model:
In this model, electrons are described as wavefunctions, indicating a probability distribution rather than a specific orbit.
The Heisenberg Uncertainty Principle states that it is impossible to simultaneously know both the exact position and momentum of an electron.
Therefore, electrons are best described as existing in cloud-like orbitals where we can only estimate the likelihood of finding them.
This probabilistic nature of electron position is central to understanding why photoelectron spectroscopy is necessary for examining atomic structure.
The Nature of Light
Light, although often thought of as a wave, also behaves like a particle. This concept is known as wave-particle duality.
Photons: Light as a Particle
A photon is a quantum of electromagnetic energy.
Each photon carries a discrete amount of energy that depends on its frequency.
This idea, introduced by Albert Einstein, was essential to explaining the photoelectric effect, which led to the development of PES.
Frequency and Energy of Light
The frequency (ν) of light is the number of wave cycles that pass a fixed point in one second. It is directly proportional to the energy (E) of a photon.
The relationship is described by the equation:
E = h * ν
Where:
E = energy of the photon (in joules)
h = Planck’s constant (6.626 x 10^-34 J·s)
ν = frequency of the light (in hertz)
Higher frequency light corresponds to higher energy photons, which are capable of ejecting more tightly bound electrons from atoms.
The Photoelectric Effect
The photoelectric effect is a phenomenon in which light causes electrons to be ejected from the surface of a material.
Key principles of the photoelectric effect:
When light with energy above a certain threshold hits a metal surface, it can eject electrons.
If the light’s frequency is too low, no electrons are emitted, regardless of the intensity of the light.
If the frequency is high enough, electrons are emitted with kinetic energy that can be measured.

Image Courtesy of Google; you can see here that only photons that reach the given threshold of -2.0 eV can eject an electron from this metal, potassium.
This effect demonstrated that light energy is quantized and supports the existence of photons.
The relationship between the photon energy, electron binding energy, and electron kinetic energy is given by:
Binding Energy = Photon Energy - Kinetic Energy of the Ejected Electron
This equation is the foundational principle behind photoelectron spectroscopy.
Introduction to Photoelectron Spectroscopy (PES)
Photoelectron spectroscopy (PES) is a laboratory technique that uses the photoelectric effect to analyze the electronic structure of atoms and molecules.
Purpose of PES
PES allows scientists to:
Determine the binding energies of electrons in different orbitals.
Identify the electron configuration of atoms.
Distinguish between core and valence electrons.
Understand the relative energy levels of electrons in different orbitals.
This makes PES an essential tool for probing atomic structure and gaining deeper insights into electron arrangement.
How PES Works
A sample is exposed to high-energy ultraviolet (UV) or X-ray photons.
These photons strike the atoms in the sample, causing photoelectrons to be emitted.
The kinetic energy of each ejected electron is measured.
Using the known energy of the photons and the measured kinetic energy, the binding energy of each electron is calculated.

Image Courtesy of Chemdx
The formula used is:
Binding Energy = Energy of Photon - Kinetic Energy of Electron
This calculated binding energy reflects the amount of energy required to remove an electron from a particular orbital, giving information about the electron's location within the atom.
Interpreting a Photoelectron Spectrum
A photoelectron spectrum is a graph that plots the binding energy of electrons (x-axis) against the relative number of electrons (y-axis).

Image Courtesy of Chemmybear
The X-Axis: Binding Energy
The x-axis shows how much energy is required to remove an electron.
Electrons that are closer to the nucleus are more tightly held and thus have higher binding energies.
As a result, core electrons appear on the left side of the spectrum, and valence electrons on the right.
The Y-Axis: Number of Electrons
The y-axis shows the relative number of electrons in each sublevel.
The height of each peak corresponds to the number of electrons in a given orbital.
Example: Interpreting Carbon’s PES
Let’s examine the PES of carbon, which has six electrons:
A large peak on the left corresponds to the 1s orbital (2 electrons).
The next peak, slightly lower in binding energy, is the 2s orbital (2 electrons).
A third peak at even lower binding energy corresponds to the 2p orbital (2 electrons).
From this, we can deduce the electron configuration: 1s² 2s² 2p². The element must be carbon.
Key Concepts for PES Interpretation
Peak position (x-axis) tells us the energy required to remove an electron from that sublevel.
Peak height (y-axis) tells us the number of electrons in that sublevel.
The left side of the graph corresponds to core electrons with higher binding energy.
The right side corresponds to valence electrons, which are less tightly held.
Identifying Elements with PES
To identify an element using PES:
Count the total number of electrons represented by the spectrum (add up peak heights).
Assign peaks to sublevels (1s, 2s, 2p, etc.) based on their binding energy and electron count.
Use the electron configuration to match it with an element on the periodic table.
This technique is especially useful when analyzing unknown substances or ions.
Comparing PES of Different Elements
Atoms with more protons will generally have higher binding energies, because the increased nuclear charge pulls electrons in more tightly.
For example, the 1s electrons of oxygen will have a higher binding energy than the 1s electrons of carbon.
Ions can also be analyzed. Removing electrons increases the effective nuclear charge, resulting in higher binding energies for the remaining electrons.
Common AP-Style PES Questions
Example Question 1:
The PES of neon shows a peak (A) far to the left of two others (B and C). Why is peak A further left?
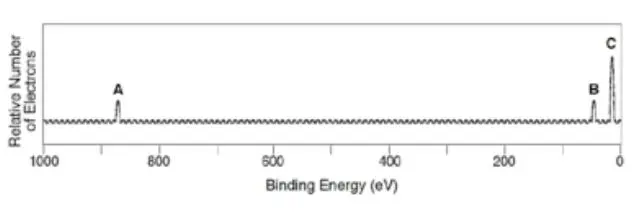
Correct Answer:
C. Core electrons experience a much greater attraction to the nucleus than valence electrons.
Example Question 2:
Which peak corresponds to electrons closest to the nucleus?
Correct Answer:
Peak A, because it has the highest binding energy.
These types of questions are common on the AP Chemistry and AP Biology exams, and require a solid understanding of how to interpret PES data.
Practice: Identifying an Element
Suppose a PES graph shows three peaks:
Peak 1: Binding energy of 800 eV, 2 electrons (1s)
Peak 2: Binding energy of 150 eV, 2 electrons (2s)
Peak 3: Binding energy of 80 eV, 6 electrons (2p)
Add the electrons: 2 + 2 + 6 = 10 electrons
The configuration: 1s² 2s² 2p⁶
Element: Neon (Ne)
This exercise demonstrates how PES is used to determine electron configurations and identify elements.
Vocabulary to Review
Photoelectron Spectroscopy (PES): A technique for determining electron energies by measuring electrons ejected from a sample after photon exposure.
Photon: A particle representing a quantum of light or electromagnetic radiation.
Binding Energy: The energy needed to remove an electron from an atom.
Kinetic Energy: The energy an electron has after being ejected from the atom.
Electron Configuration: The distribution of electrons among orbitals in an atom.
Valence Electrons: Electrons in the outermost shell, involved in chemical bonding.
Core Electrons: Electrons in inner shells, closer to the nucleus.
Wave-Particle Duality: Concept that light and electrons exhibit both wave-like and particle-like properties.
Heisenberg Uncertainty Principle: States that one cannot simultaneously know the exact position and momentum of an electron.
Photoelectric Effect: The phenomenon of electron ejection when light of sufficient energy strikes a surface.
FAQ
Photoelectron spectroscopy (PES) is most effective when applied to gaseous atoms because this state allows for the clearest interpretation of binding energies without interference from intermolecular forces or complex bonding environments. In solids or liquids:
Electron energies are affected by surrounding atoms or molecules, which can shift or broaden the PES peaks and make them harder to interpret.
Energy bands form in solids due to electron delocalization, making it difficult to assign peaks to specific orbitals.
In contrast, gaseous atoms exist as isolated units with clearly defined energy levels, allowing for precise measurements of individual subshell binding energies.
Also, in gases, there is minimal electron shielding beyond intrinsic atomic structure, improving the accuracy of energy calculations.
This makes PES ideal for determining fundamental atomic properties and pure electron configurations.
Photoelectron spectroscopy is not typically used to detect isotopes, because it measures the energy of electrons, which is determined by the electronic structure and nuclear charge, not the mass of the nucleus.
Isotopes of an element have the same number of protons and electrons, so their electron configurations and binding energies are nearly identical.
The difference between isotopes lies in the number of neutrons, which affects the mass but not the electromagnetic attraction felt by the electrons.
PES does not detect nuclear mass differences and therefore cannot distinguish between isotopes like carbon-12 and carbon-13.
Techniques like mass spectrometry are better suited for isotope analysis, as they measure differences in mass-to-charge ratios.
Several experimental and atomic-level factors can influence the accuracy and interpretation of a photoelectron spectrum:
Photon energy source: If the light source does not have sufficient energy, it may not eject inner-shell electrons, skewing the spectrum toward outer orbitals.
Calibration errors: Inaccurate calibration of the kinetic energy detector can lead to incorrect binding energy calculations.
Sample contamination: Impurities or molecular interactions can produce additional peaks or obscure true atomic peaks.
Energy resolution: Low-resolution instruments may blur adjacent peaks, especially in atoms with closely spaced subshells.
Electron shielding effects: Differences in shielding between subshells can slightly shift peak positions.
Electron-electron repulsion: In multi-electron atoms, repulsion can affect electron binding energies, particularly in partially filled orbitals.
Careful control and calibration are essential to produce high-quality PES data.
Photoelectron spectroscopy provides indirect but powerful insight into the effective nuclear charge (Zeff), which is the net positive charge experienced by an electron in a multi-electron atom.
Binding energy trends observed in PES reflect how strongly electrons are held by the nucleus.
Core electrons, with high binding energy, experience a strong Zeff due to their proximity to the nucleus and low shielding.
Valence electrons, which show lower binding energy, experience a lower Zeff due to increased shielding from inner electrons.
By comparing binding energies across elements in a period, you can observe increasing Zeff as protons are added without significantly increasing shielding.
This helps explain periodic trends like atomic size and ionization energy, making PES a tool for visualizing how Zeff affects electron distribution.
While PES is extremely effective for atoms and small molecules, it has several limitations when analyzing large or complex molecular structures:
Overlapping peaks: Molecules often have many electrons in similar energy environments, causing peaks to overlap and making assignments ambiguous.
Delocalized electrons: In molecules with resonance or conjugated systems, electrons are not confined to specific atoms or orbitals, complicating the spectrum.
Bonding effects: Chemical bonding can shift electron binding energies from their atomic values, especially in polar covalent or ionic environments.
Multiple ionization pathways: Molecules can fragment or ionize in various ways under high-energy photons, creating additional signals not related to intact orbitals.
Interpretation complexity: Unlike atomic PES, molecular PES requires detailed computational modeling to match observed spectra with theoretical predictions.
Despite these challenges, PES remains useful when combined with other techniques like computational chemistry or spectroscopy to study molecular structure.
Practice Questions
A photoelectron spectrum for an unknown element shows three peaks. The first peak (at highest binding energy) has 2 electrons, the second peak has 2 electrons, and the third peak has 5 electrons. Based on this spectrum, determine the electron configuration and identify the element. Explain your reasoning.
The photoelectron spectrum indicates three distinct peaks corresponding to three sublevels: 1s, 2s, and 2p. The first peak with 2 electrons represents the 1s orbital, the second with 2 electrons is the 2s orbital, and the third with 5 electrons corresponds to the 2p orbital. Adding the electrons gives a total of 9. Therefore, the electron configuration is 1s² 2s² 2p⁵, which matches the configuration of fluorine. Since the periodic table confirms that fluorine has 9 electrons, the element is fluorine. The peak positions and heights support this conclusion by matching expected electron counts and relative binding energies for each sublevel.
Explain why the 1s electrons appear at a higher binding energy than the 2p electrons in a photoelectron spectrum. Include reference to atomic structure and nuclear attraction in your explanation.
The 1s electrons appear at a higher binding energy because they are closest to the nucleus and experience the strongest electrostatic attraction from the positively charged protons. These core electrons are shielded the least and must overcome a greater force to be removed. In contrast, the 2p electrons are located in a higher energy level, further from the nucleus, and are more shielded by inner electrons. As a result, they are held less tightly and require less energy to remove. The position of the 1s peak on the spectrum reflects this greater binding energy compared to the outer 2p electrons.
