
AP Syllabus focus:
‘Geospatial technologies include GIS, satellite navigation systems, remote sensing, and online mapping and visualization tools.’
Geospatial technologies provide powerful methods for capturing, analyzing, and displaying Earth’s spatial information, enabling geographers to identify patterns, relationships, and processes that shape human and environmental systems.
Understanding Geospatial Technologies
Geospatial technologies refer to digital tools that collect, store, analyze, and visualize geographic data. These technologies allow geographers to interpret spatial patterns at multiple scales and support research, planning, and decision-making.
Key Components of Geospatial Technologies
The AP Human Geography specification highlights three major technologies: GIS, GPS, and remote sensing, alongside related online mapping and visualization tools.
Geographic Information Systems (GIS)
GIS integrates spatial data (location-based information) with attribute data (descriptive information) in layered digital maps. This combination allows users to examine relationships between different types of data within the same geographic area.
Geographic Information Systems (GIS): A computer-based system that captures, stores, analyzes, and displays spatial and attribute data in layered maps.
A GIS database can include layers such as population density, land use, transportation networks, or environmental features.
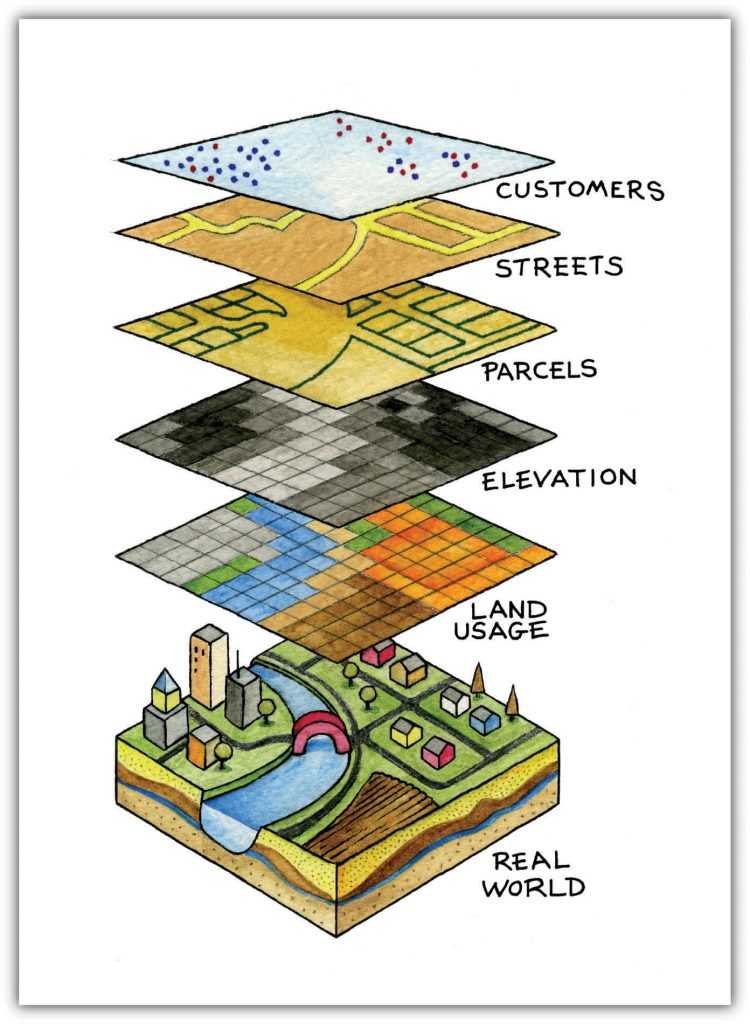
This diagram illustrates how multiple thematic layers are combined within a Geographic Information System to reveal spatial relationships. Each layer represents a distinct category of information that can be analyzed together. Although the specific labels exceed AP requirements, they clearly demonstrate the concept of layered spatial data. Source.
Each layer represents a distinct category of data but can be analyzed together to reveal patterns, correlations, and spatial relationships.
How GIS Works
GIS operates through a system of layers that help geographers isolate or combine information.
Data input: Collecting spatial and attribute data from fieldwork, satellite imagery, surveys, or government databases.
Data management: Organizing data into layers, ensuring consistency in scale, projection, and format.
Spatial analysis: Using computational tools to examine patterns, such as clustering, proximity, or changes over time.
Visualization: Displaying results through digital maps, charts, or 3D models to show spatial trends.
Applications of GIS
GIS supports a wide range of geographic inquiries:
Urban planning and zoning
Natural hazard assessment
Environmental management and conservation
Transportation routing
Public health and epidemiology
Business market analysis
GIS is central to modern spatial decision-making across local, national, and global scales.
Global Positioning System (GPS)
GPS is a satellite-based navigation system used to determine precise absolute location on Earth’s surface. It operates through a network of orbiting satellites that transmit signals to receivers on the ground.
Global Positioning System (GPS): A satellite-based system that provides precise absolute location data to receivers on Earth.
GPS calculates location using the time delay between satellite signals and the receiver. The system requires signals from at least four satellites to determine accurate coordinates.
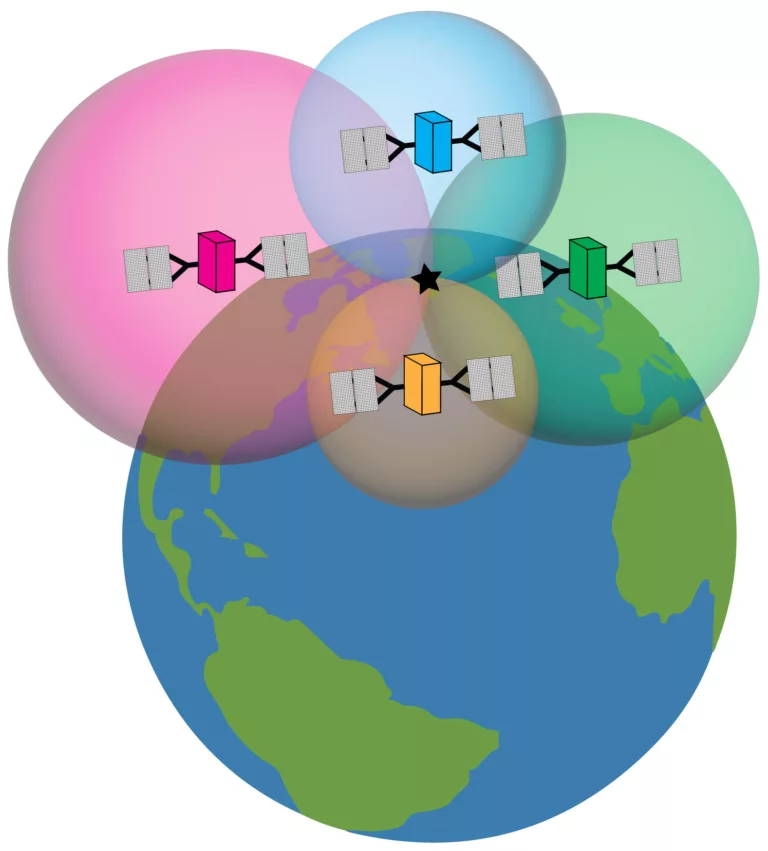
This diagram shows how GPS trilateration uses distance measurements from multiple satellites to determine a receiver’s exact location on Earth. Spheres represent possible distance ranges, and their intersection indicates position. The visual includes technical detail beyond AP expectations but effectively demonstrates the core principle of satellite-based location calculation. Source.
Uses of GPS in Human Geography
GPS technology is widely used in:
Navigation for individuals, vehicles, and aircraft
Field data collection, assisting geographers in recording exact positions of observed features
Mapping, allowing researchers to track movement patterns, migration routes, or land-use changes
Geotagging, attaching location data to photographs or digital records
GPS enhances the accuracy and consistency of geographic data, making it essential for research and spatial analysis.
Remote Sensing
Remote sensing refers to the collection of data about Earth’s surface without direct physical contact. It relies on sensors mounted on satellites, aircraft, or drones, which detect reflected or emitted energy.
Remote Sensing: The process of collecting spatial information about Earth’s surface from a distance using sensors on satellites, aircraft, or drones.
Remote sensing produces continuous, large-scale data that allows geographers to observe environmental and human processes across wide areas and over time.
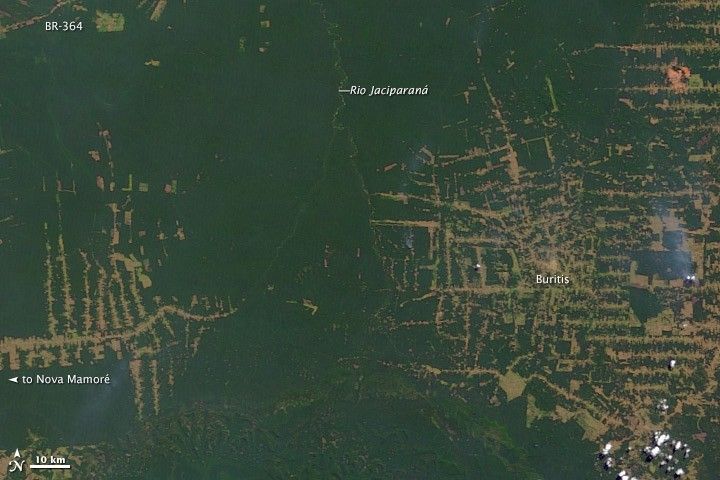
This satellite image from NASA’s Earth Observatory highlights contrasting patterns of intact forest and cleared land in the Amazon. It demonstrates how remote sensing detects environmental change across large regions. The specific location and year exceed syllabus requirements but clearly illustrate how satellite imagery reveals land-use transformation over time. Source.
Types of Remote Sensing Data
Remote sensing data can include:
Optical imagery, such as true-color photographs
Infrared imagery, used to study vegetation health
Thermal imagery, capturing land or water temperatures
Radar data, penetrating clouds or vegetation to reveal surface structures
Each type of imagery offers distinct insights into spatial patterns and landscape change.
Applications of Remote Sensing
Remote sensing supports geographic analysis through:
Monitoring deforestation, desertification, or wetland loss
Assessing agricultural productivity
Tracking urban expansion
Observing natural disasters such as wildfires, hurricanes, or floods
Mapping climate and atmospheric conditions
The ability to compare images over time makes remote sensing invaluable in studying long-term environmental change.
Online Mapping and Visualization Tools
Modern geospatial technologies extend beyond specialized software to widely accessible online platforms. These tools allow individuals and organizations to view, share, and analyze spatial data.
Common Online Tools
Examples include:
Web-based GIS platforms, offering interactive mapping
Crowdsourced mapping applications, allowing users to contribute real-time data
Virtual globes such as widely used mapping software
Story map tools, combining narrative and spatial data
These platforms democratize geographic analysis by making spatial information easier to access and interpret.
Importance for Geographic Understanding
Online mapping tools support:
Visual interpretation of geographic data
Public participation in spatial decision-making
Rapid dissemination of information during emergencies
Educational engagement with spatial concepts
Online tools expand the reach of geospatial technologies and broaden how geographic information is shared across communities and institutions.
Integrating Geospatial Technologies in Human Geography
GIS, GPS, remote sensing, and online mapping tools collectively enable geographers to examine spatial processes more precisely and efficiently. These technologies enhance the ability to observe patterns, analyze relationships, and support evidence-based decisions grounded in spatial understanding.
Practice Questions
Question 1 (1–3 marks)
Explain one way that geographers use remote sensing to study environmental change.
Question 1
1 mark: Basic statement identifying a use of remote sensing.
Example: Remote sensing is used to observe land cover from satellite images.
2 marks: Clear description of how remote sensing supports environmental analysis.
Example: It allows geographers to monitor deforestation over large areas.
3 marks: Detailed explanation showing understanding of spatial or temporal patterns.
Example: Remote sensing provides repeated satellite images that allow geographers to track changes in forest loss over time and identify areas of rapid environmental change.
Question 2 (4–6 marks)
Describe how GIS and GPS can be used together to support urban planning. In your answer, refer to the type of data each technology provides and how this data can be combined to inform planning decisions.
Question 2
1 mark: Identifies a function of GIS (e.g., layering spatial data, analysing patterns).
1 mark: Identifies a function of GPS (e.g., providing precise location coordinates).
1 mark: Describes how GPS data can be incorporated into GIS (e.g., mapping field-collected points).
1–2 marks: Explains how combining GIS and GPS aids urban planning (e.g., mapping infrastructure, assessing land use, improving transport planning).
1 mark: Provides a developed example or clear explanation of a planning decision informed by these technologies (e.g., locating suitable areas for new housing based on accessibility and environmental constraints).
FAQ
Geographers choose layers based on the specific question they are trying to answer. A GIS project analysing flood risk, for example, may require elevation data, land cover, drainage networks, and settlement patterns.
They also consider:
Data reliability and resolution
Whether layers share the same scale or projection
How easily attribute data can be linked to spatial features
The goal is to select only the layers that meaningfully contribute to the analysis.
Passive remote sensing records natural energy reflected or emitted from Earth’s surface, such as visible light or infrared radiation.
Active remote sensing sends out its own signal and measures the return, such as radar or LiDAR.
The distinction matters because active systems can collect data at night or through cloud cover, making them useful for areas with frequent storms or dense vegetation.
Tall buildings can block or reflect satellite signals, creating a phenomenon called multipath interference, where the receiver picks up delayed or distorted signals.
Urban canyons may also reduce the number of satellites visible at once, making it harder to calculate an accurate position.
These issues explain why GPS-based navigation can struggle in dense city centres.
Long-term datasets reveal slow or gradual changes that are difficult to observe on the ground.
Common applications include:
Urban expansion and peri-urban growth
Shifts in agricultural land use
Desertification trends
Loss of wetlands or coastal erosion
Forest regrowth after fires or logging
The ability to compare decades of imagery allows geographers to separate temporary changes from long-term transformations.
Publicly accessible mapping tools allow citizens to explore spatial information on hazards, transport routes, or planning proposals.
They can improve transparency by letting people view data previously limited to government or specialist organisations.
These platforms can also encourage civic engagement, as residents can report issues, contribute crowdsourced data, or participate in community mapping initiatives that inform local policy.
