
AP Syllabus focus:
‘Geospatial and geographic data (including census data and satellite imagery) provide evidence for understanding places and patterns.’
Geographers rely on key data sources to interpret spatial patterns. Census data and satellite imagery form the foundation of modern geographic inquiry, supporting rigorous analysis at multiple scales of investigation.
Key Data Sources in Human Geography
The Central Role of Geographic Data
Understanding human and environmental patterns depends on reliable, large-scale geospatial and geographic data, which provide measurable evidence of how people and environments are distributed, change over time, and interact across space. Among the most essential sources are census data and satellite imagery, each offering distinct but complementary insights into demographic, socioeconomic, and physical landscapes.
Census Data
What Census Data Provide
Census data refer to systematically collected information about a population, typically conducted by national governments at regular intervals. These data include demographic, social, and economic characteristics of individuals and households. Because these data cover entire populations rather than samples, they allow geographers to identify precise spatial patterns.
Census: A comprehensive count and survey of a population, usually conducted by a government at regular intervals to collect demographic, social, and economic data.
Census data are foundational to geographic research because they enable the mapping and analysis of human characteristics at fine levels of detail. These datasets are typically organized into geographic units such as census tracts, counties, or municipalities, allowing geographers to examine variations across space.
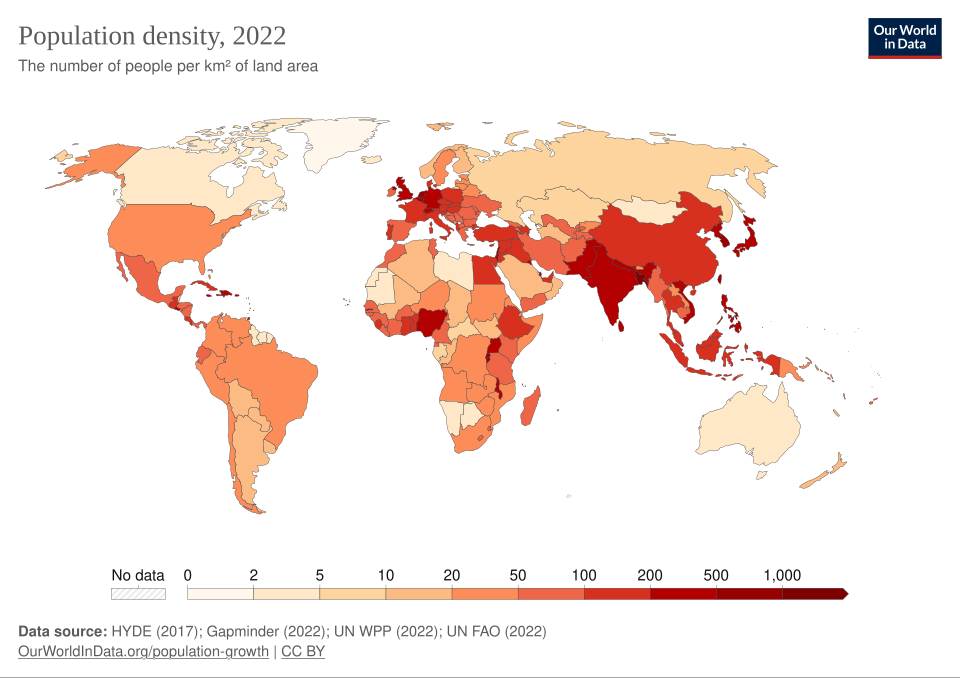
This choropleth map shows global population density, with darker shades indicating more people per square kilometer and lighter shades indicating fewer. It illustrates how census-based data can be converted into a spatial visualization highlighting clear regional patterns of population concentration and sparsity. The legend below the map provides more numerical detail than required by the syllabus but reinforces how demographic data are classified for geographic interpretation. Source.
After introducing such detailed population measures, it becomes possible to analyze broader trends and relationships that would otherwise be invisible at smaller scales or through qualitative observation alone.
Geographic Uses of Census Data
Geographers employ census data to:
Identify demographic patterns, such as population density, age structure, ethnicity, or household size.
Track spatial trends in migration, suburbanization, or urbanization.
Support planning decisions, such as school locations, infrastructure investment, or housing development.
Examine socioeconomic inequalities by mapping income, employment, or educational attainment patterns.
Analyze political outcomes, including redistricting and representation.
The large scale and reliability of census data make it indispensable for understanding how human characteristics vary across regions and how these variations influence broader geographic processes.
Satellite Imagery
What Satellite Imagery Reveals
Satellite imagery consists of remotely sensed images captured by orbiting satellites that record reflected or emitted energy from Earth’s surface. These images provide consistent, repeated, and high-resolution observations of physical and sometimes human-made features.
Remote Sensing: The process of collecting data about Earth’s surface from a distance, typically through satellites or aircraft that record energy patterns.
Because satellites regularly revisit the same locations, they allow geographers to detect changes over time, making them powerful tools for environmental monitoring and human–environment analysis.
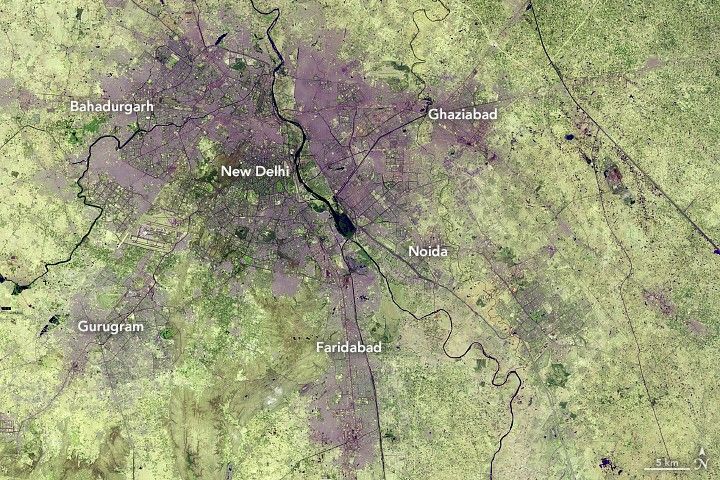
This satellite image pair shows the expansion of New Delhi and adjacent cities over several decades, with dense urban areas visible in darker tones. It demonstrates how remote sensing reveals changes in settlement patterns and land use that are not easily observed on the ground. The annotations and specific place names included by NASA extend beyond the syllabus but help contextualize the concept of urban growth. Source.
Satellite imagery enhances geographic understanding by capturing patterns that cannot be easily detected from ground-based observations. For example, subtle vegetation changes, urban expansion, or shifts in water bodies are visible through spectral signatures that satellites record across multiple wavelengths.
Geographic Uses of Satellite Imagery
Geographers use satellite imagery to:
Observe land-use and land-cover changes, such as deforestation, agricultural expansion, and urban development.
Monitor environmental conditions, including drought severity, flooding, wildfires, and snow or ice coverage.
Analyze spatial patterns in settlement distribution, transportation networks, and built environments.
Measure physical features, such as elevation through radar-based sensors or terrain models.
Support disaster response, providing rapid assessment after hurricanes, earthquakes, or other hazards.
The visual and measurable qualities of satellite imagery make it essential for understanding both natural and human-made patterns.
How Census Data and Satellite Imagery Work Together
Complementary Strengths
When combined, census data and satellite imagery offer powerful tools for geographic analysis:
Census data provide human characteristics, while satellite imagery provides environmental and spatial context.
Census data describe who lives where, while satellite imagery reveals what the landscape looks like and how it is changing.
Together, they allow geographers to interpret relationships among people, places, and environments across scales.
A typical geographic investigation might use satellite imagery to detect urban growth and census data to analyze which populations are driving that growth and how it affects socioeconomic conditions. This blend of qualitative spatial imagery and quantitative demographic data strengthens the validity and depth of geographic conclusions.
Uses Across Geographic Scales
These data sources support decision-making at:
Local scales, such as planning community services or assessing neighborhood change.
National scales, including policy development, transportation planning, or environmental regulation.
Global scales, where satellite imagery is especially critical for monitoring climate change, global urbanization, and environmental degradation.
Geospatial and geographic data, particularly census data and satellite imagery, therefore form the empirical backbone of spatial analysis in AP Human Geography and support the discipline’s emphasis on evidence-based understanding of patterns and processes.
Practice Questions
Question 1 (1–3 marks)
Explain one way in which census data can be used to identify spatial patterns in a country.
Mark scheme:
• 1 mark for identifying a valid use of census data (e.g., mapping population density or age distribution).
• 1 mark for explaining how this reveals a spatial pattern (e.g., showing clusters of high population in urban areas).
• 1 mark for linking the pattern to geographic interpretation (e.g., helps understand settlement trends or service needs).
Question 2 (4–6 marks)
Using examples, analyse how satellite imagery and census data can complement each other when studying urban growth.
Mark scheme:
• 1 mark for describing a relevant feature of satellite imagery (e.g., shows land-use change over time).
• 1 mark for describing a relevant feature of census data (e.g., provides demographic information about populations in expanding areas).
• 1–2 marks for explaining how the two data sources complement each other (e.g., imagery shows physical expansion while census data show which populations are driving growth).
• 1–2 marks for applying the explanation to an example of urban growth (real or plausible) showing clear integration of both data types.
FAQ
Governments use multiple strategies to improve accuracy, particularly in areas with transient populations or difficult terrain.
Common approaches include:
Deploying specialised enumeration teams for remote regions.
Using multilingual questionnaires to reach linguistic minorities.
Cross-checking administrative records, such as tax or school data.
Conducting post-enumeration surveys to estimate undercounts.
Technologies such as digital tablets and GPS tracking are increasingly used to verify coverage and reduce duplication.
Sensors suited to human activity often capture high-resolution visual or near-infrared data that reveal built structures and urban form.
Key sensor types include:
High-resolution optical sensors that show buildings, roads, and settlement density.
Thermal sensors that identify heat signatures from urban heat islands.
Radar sensors that detect structural change, including new construction.
These sensors enable geographers to monitor development even when cloud cover or night-time conditions limit traditional optical imaging.
Statistical agencies apply several layers of confidentiality protection to ensure that individuals cannot be identified.
Methods typically include:
Aggregating data into census tracts or districts rather than releasing household-level information.
Suppressing or combining small demographic groups in areas with very few residents.
Introducing minor random “noise” to sensitive fields without affecting broad spatial patterns.
These techniques maintain privacy while still allowing geographers to study meaningful demographic trends.
Satellite imagery captures physical characteristics of land cover directly, which helps identify settlements that may not appear in official records.
Indicators include:
Densely clustered, irregularly shaped structures.
Rapid land conversion along urban peripheries.
Lack of formal street patterns or infrastructure.
Because such areas may be excluded from census counts due to legal status or inaccessibility, satellite imagery provides crucial supplemental evidence of population presence and growth.
The ideal frequency depends on the rate of change and the scale of analysis.
For fast-expanding cities:
High-resolution satellite imagery every few months allows detection of new construction, road expansion, and land-use conversion.
Annual or biannual imagery can still reveal important medium-term trends.
Census data, collected less frequently, usually every 5 or 10 years, provide demographic context that complements the more frequent physical observations from satellites.
