
AP Syllabus focus:
‘Geographic data are used at all scales for personal choices, business and organizational planning, and governmental decision-making.’
Geographic data inform decisions from the personal scale to the global scale, shaping behaviors, strategies, and policies across society. Understanding how these data guide choices reveals geography’s practical power.
Using Geographic Data Across Multiple Scales
Geographers analyze geographic data to understand spatial patterns, evaluate conditions, and support decision-making that varies depending on the scale of analysis, which refers to the level at which geographic phenomena are examined. The same dataset can produce different insights when viewed at local, national, or global scales, making scale selection a critical component of effective interpretation.
Geographic Data: Information tied to a location, describing spatial patterns, distributions, or characteristics of people, environments, or places.
Geographic data allow individuals, organizations, and governments to assess spatial relationships, identify trends, anticipate future needs, and solve problems. Whether derived from census counts, satellite imagery, or mobile device location data, these data provide evidence used to make informed decisions at every scale of society.
Personal-Scale Decision-Making
Individuals routinely rely on geographic data—often without noticing—to navigate daily life. In many cases, these decisions involve evaluating spatial information to optimize time, safety, or efficiency.
How Individuals Use Geographic Data
Selecting transportation routes using navigation apps that integrate real-time traffic patterns.
Choosing where to live or shop by examining neighborhood demographics, accessibility, or environmental risks.
Assessing weather forecasts, hazard maps, or air quality indices to guide daily activities.
Locating amenities such as schools, hospitals, or parks based on proximity and connectivity.
Personal choices increasingly depend on geolocated digital data, illustrating how human behavior is shaped by the availability and interpretation of spatial information.
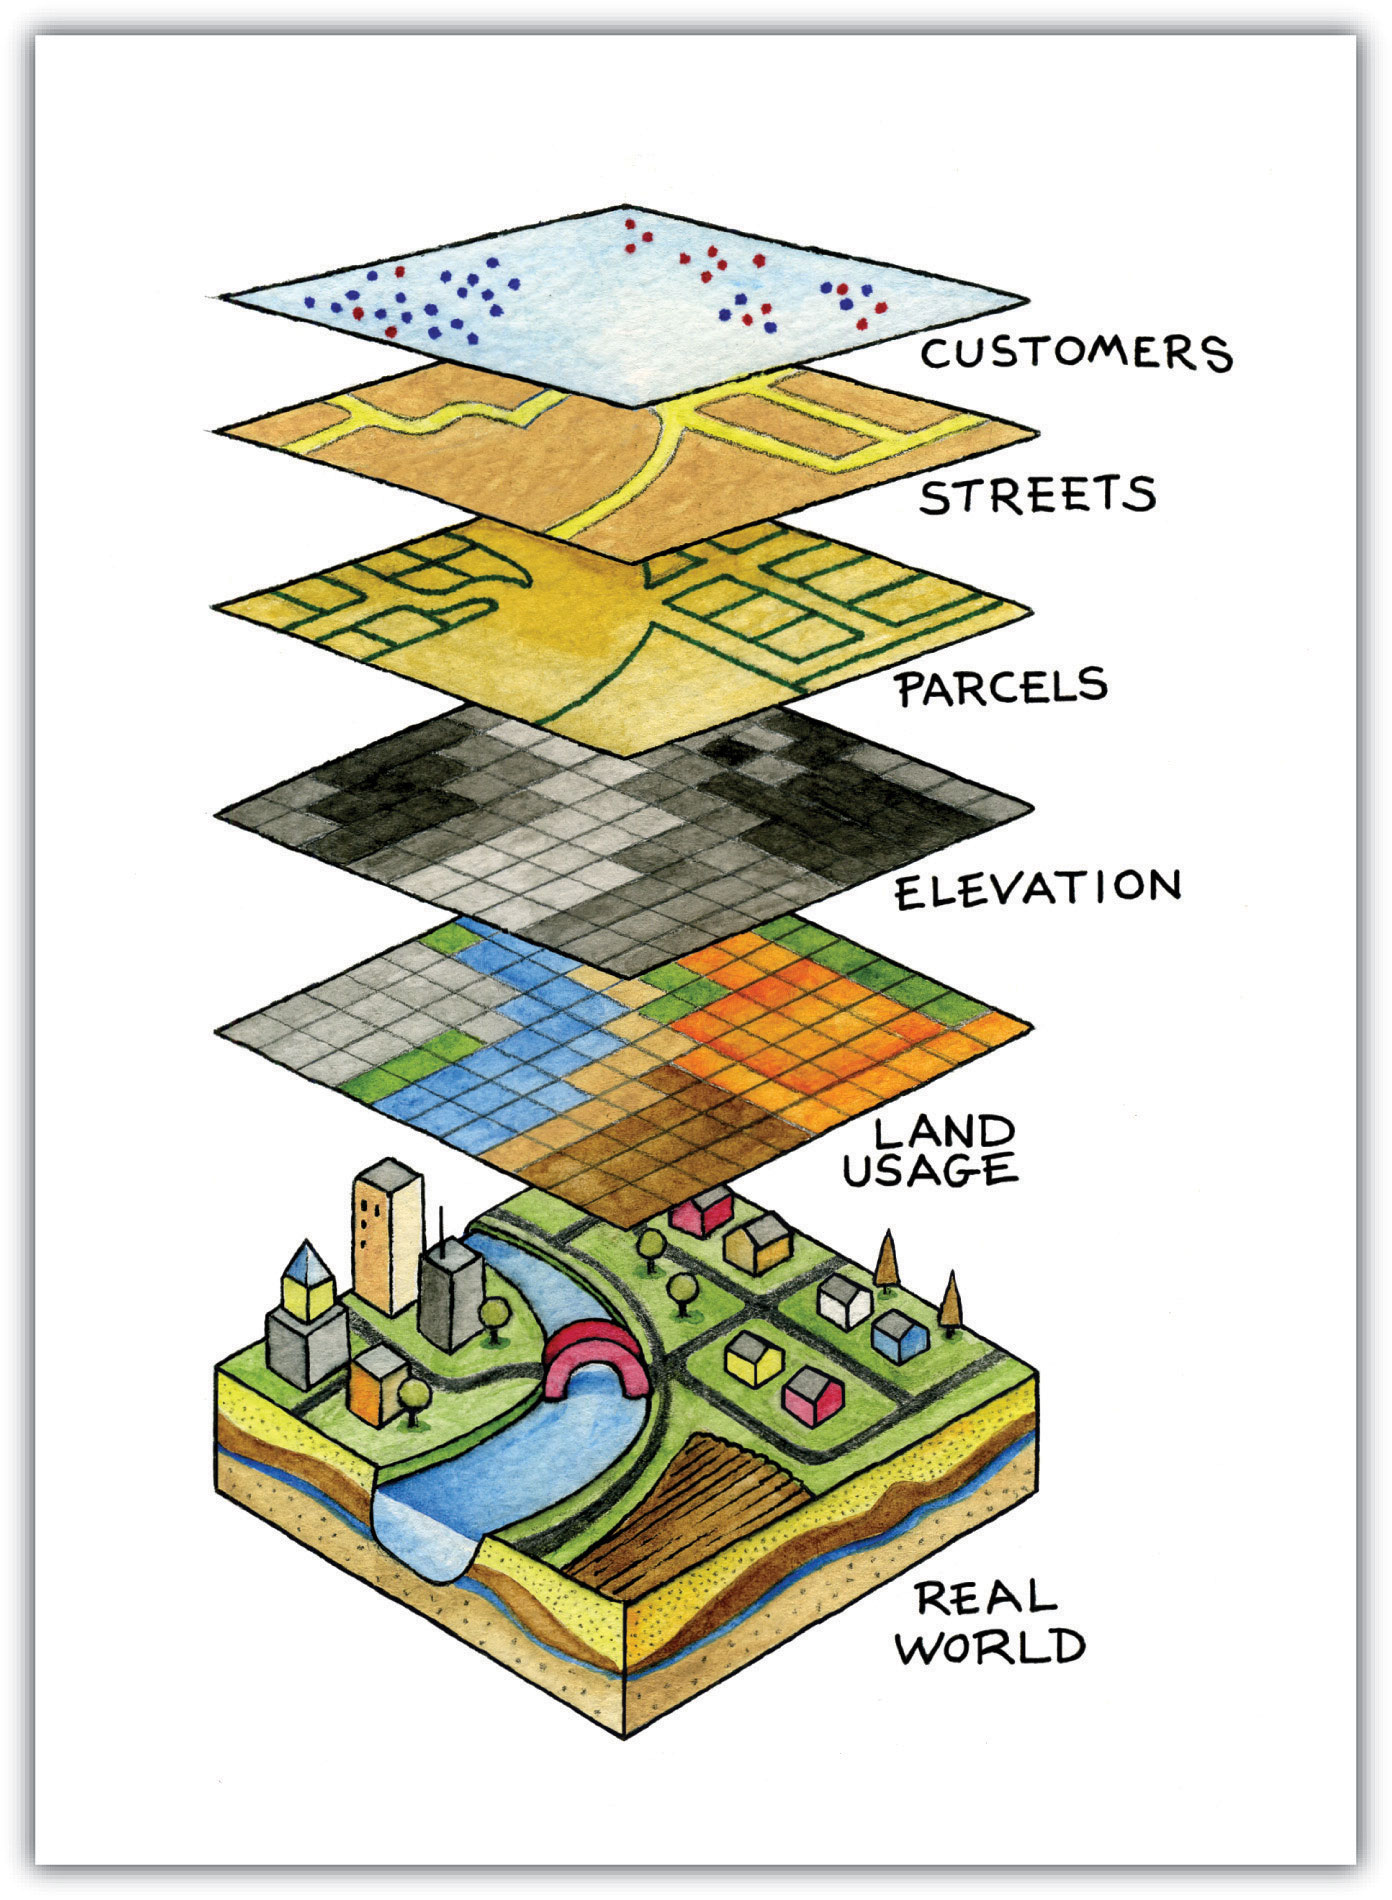
This conceptual diagram represents the real world as stacked GIS layers: land usage, elevation, parcels, streets, and customers. By combining these layers, analysts can identify where people live, how they move, and which locations are best suited for particular activities or services. The specific labels are more detailed than the AP syllabus requires, but they clearly show how real-world decision-making relies on integrated geographic data. Source.
Business and Organizational Planning
Businesses and nonprofits depend heavily on geographic data to reduce uncertainty and allocate resources effectively. The ability to understand spatial patterns—such as where customers live or how goods move through supply chains—supports strategic decision-making.
Key Applications in Business and Organizations
Market-area analysis to identify potential customers and determine where to open new stores or facilities.
Logistics optimization, using spatial data to shorten shipping routes and improve delivery efficiency.
Site selection for offices or warehouses based on transportation networks, workforce distribution, and zoning restrictions.
Risk management, including the use of hazard maps to minimize exposure to floods, fires, or pollution.
Community outreach planning, where nonprofits use demographic and socioeconomic data to decide where services are most needed.
Businesses also rely on geographic information systems (GIS) to visualize spatial patterns and build predictive models. These tools allow decision-makers to evaluate multiple datasets simultaneously—such as income levels, infrastructure, and land-use patterns—before finalizing plans.
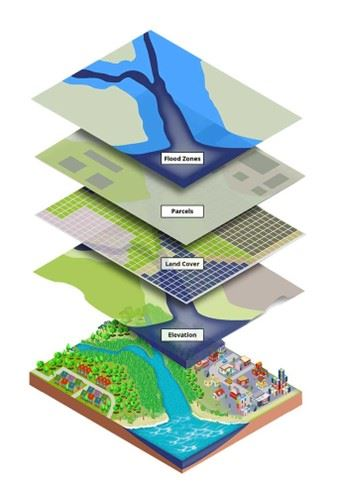
GIS data layers such as parcels, zoning, topography, wetlands, demographics, and imagery can be stacked in a GIS to support land-use, infrastructure, and hazard planning. This layered structure allows planners to see how different spatial factors interact in the same location and to base policy or investment decisions on evidence. The specific layer names go beyond the AP syllabus but illustrate how diverse real-world datasets feed into geographic decision-making. Source.
Governmental Decision-Making Across Scales
Governments at all levels use geographic data to guide resource allocation, policy development, and long-term planning. Because public decisions affect entire populations, the accuracy and scale of geographic data are especially important.
Local Government
Local officials frequently use fine-scale geographic data to address immediate community needs:
Mapping infrastructure such as water lines, roads, and emergency services.
Determining zoning regulations and land-use priorities.
Evaluating environmental risks and planning mitigation strategies.
Supporting public health campaigns using neighborhood-level data on disease distribution.
National Government
National policymakers use geographic data to understand broad trends and allocate resources equitably:
Using census data to determine congressional representation and distribute federal funding.
Planning national transportation networks such as highways and rail lines.
Assessing agricultural production patterns to shape food security policies.
Monitoring national economic indicators related to labor regions, migration, and urbanization.
Global and International Scales
At global scales, geographic data inform international cooperation and responses to large-scale challenges:
Tracking climate change through satellite observations of temperature, sea-level rise, and vegetation health.
Mapping global migration flows to understand demographic shifts and humanitarian needs.
Coordinating international disaster responses by analyzing hazard zones, population density, and infrastructure vulnerabilities.
Identifying geopolitical patterns such as trade networks, conflict zones, and territorial disputes.
Integrating Geographic Data Into Multiscale Decisions
Because geographic processes operate across overlapping scales, effective decision-making often depends on integrating data from multiple levels. A local flood map, for example, may be informed by national rainfall models and global climate data. Similarly, an individual’s housing decision may be shaped by neighborhood features as well as regional economic conditions.
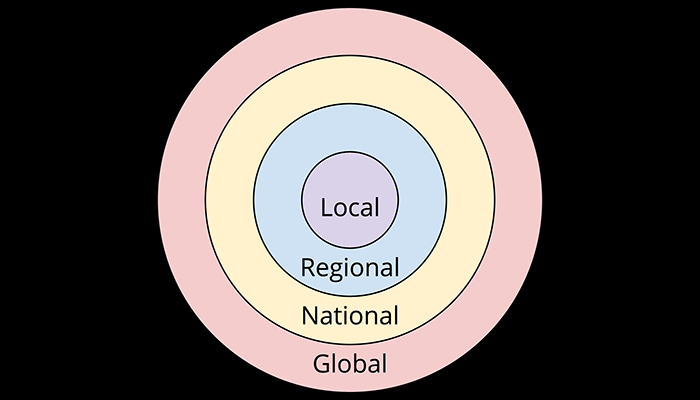
This diagram shows local, regional, national, and global scales as nested circles, emphasizing how geographic phenomena are embedded within broader contexts. It reinforces the idea that decisions made at one scale are influenced by processes operating at other scales and that geographic data must often be interpreted across multiple levels. The original figure comes from a broader discussion of scale in geography but applies directly to AP Human Geography’s focus on using data at different scales. Source.
Benefits of Multiscale Analysis
Reveals spatial variation that remains hidden at a single scale.
Helps policymakers identify unintended consequences of local or national decisions.
Supports more equitable and sustainable planning by incorporating diverse perspectives.
Strengthens the accuracy of predictions and models by using comprehensive datasets.
Geographic data thus serve as a critical foundation for decision-making across personal, organizational, governmental, and global contexts, illustrating how spatial information shapes real-world actions at every scale.
Practice Questions
Question 1 (1–3 marks)
Explain one way in which geographic data can support decision-making by local government.
Mark scheme:
1 mark for identifying a valid use (e.g., planning emergency services, zoning decisions, assessing environmental risks).
1 mark for describing how geographic data are used (e.g., mapping hazard zones or population distribution).
1 mark for linking the data use to improved decision-making (e.g., efficient resource allocation, safer land-use planning).
Question 2 (4–6 marks)
Using examples, analyse how geographic data can influence decision-making at different scales, from personal choices to national or global planning.
Mark scheme:
1 mark for describing use of geographic data at the personal scale (e.g., navigation apps, choosing where to live).
1 mark for describing use at the organisational or business scale (e.g., site selection, logistics).
1 mark for describing use at the governmental scale (local, national, or global).
1 mark for explaining how scale affects the type of data required or the decisions made.
1 mark for providing at least one example that illustrates data use at any scale.
1 additional mark for analysis showing how multiscale data provide different insights or shape outcomes differently.
FAQ
The choice of scale depends on the scope of the issue and the level at which patterns become meaningful.
For example, local flooding predictions require fine-grained topographic and rainfall data, while national transport planning relies on broader regional connectivity maps.
Geographers assess:
The spatial extent of the problem
The resolution at which variation becomes significant
The types of decisions stakeholders need to make
Using too broad a scale can hide local variation, while too narrow a scale can obscure wider trends.
Personal digital data often come from mobile phones, navigation apps, and social media check-ins. These data can show movement patterns, peak travel times, and preferred routes.
Such information is anonymised and aggregated before being used by businesses or planners. It helps improve:
Transport network efficiency
Retail site selection
Emergency response routing
This type of data highlights how everyday digital behaviour feeds into larger decision-making systems.
Businesses frequently integrate spatial information with demographic, economic, and behavioural datasets to build a more complete picture of market conditions.
Common combinations include:
Mapping customer addresses alongside income levels
Overlaying sales performance with local competitor density
Combining logistics routes with fuel cost data
This blended approach enables businesses to identify optimal locations, understand risk, and model demand more accurately.
National governments must reconcile differences in data quality, availability, and resolution across regions. Some areas may lack consistent or up-to-date datasets, which complicates planning.
They also face:
Difficulty integrating datasets from multiple agencies
Political or administrative boundaries that distort spatial patterns
The need to balance broad trends with local needs
These challenges require careful management to ensure that policymaking remains fair and evidence-based.
Satellite imagery offers consistent, standardised data across entire countries and continents, making it ideal for monitoring widespread or transboundary phenomena.
Its value comes from:
Frequent updates that show change over time
Uniform coverage that avoids regional data gaps
Ability to detect environmental indicators such as vegetation loss or surface temperature
This makes satellite data essential for addressing climate change, global migration patterns, and international disaster response.
