
AP Syllabus focus:
‘Patterns and processes can look different at different scales, revealing variation in data and leading to different interpretations.’
Geographers analyze spatial information at multiple scales because patterns, relationships, and conclusions often change when data is viewed globally, regionally, nationally, or locally.
Understanding Scale as an Analytical Tool
Scale is a foundational concept in human geography because it influences what patterns appear and how they are interpreted. Scale of analysis refers to the level at which geographic data are grouped and examined, and shifting between scales can highlight different forms of spatial variation—differences in the distribution of a phenomenon across space. These variations shape the explanations, arguments, and interpretations geographers develop about human and environmental processes.
The Influence of Scale on Geographic Patterns
Different scales reveal different spatial patterns because data aggregation changes what is visible. A global map may show broad trends, while a local map may reveal fine-grained variations masked at larger scales. This shift significantly affects how geographers understand processes such as population distribution, migration flows, political patterns, or economic development.
Why Patterns Change Across Scales
Patterns change across scales because the unit of analysis changes. When geographers zoom in or out, they select new boundaries, which alters the grouping of data. This process influences observed relationships, spatial clusters, and anomalies. It also affects the visibility of outliers, the clarity of spatial trends, and the consistency of interpretations.
The Modifiable Areal Unit Problem (MAUP)
Although not named directly in the specification, the underlying idea is useful: the way geographic areas are drawn or aggregated affects the outcome of spatial analysis. When boundaries shift, patterns may appear stronger, weaker, or entirely different.
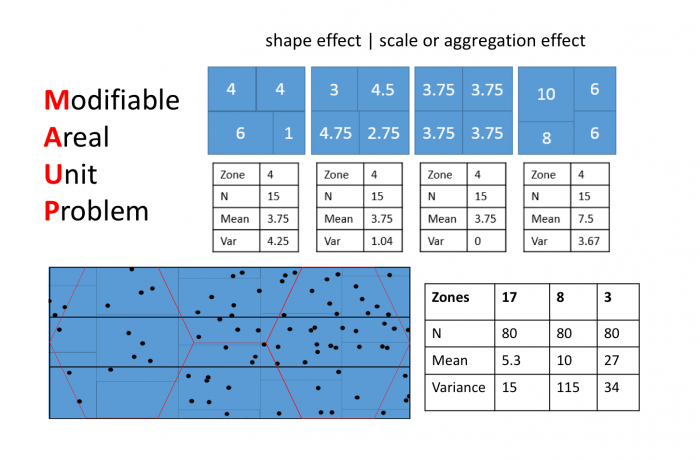
This figure illustrates how the same underlying dataset produces different means and variances when grouped into alternative zoning schemes, demonstrating the sensitivity of spatial patterns to changes in boundaries. The additional numerical tables and statistics exceed AP syllabus needs but reinforce how scale and aggregation shape interpretations. Source.
Spatial Variation: Differences in the distribution or arrangement of a geographic phenomenon across space, revealed more clearly or less clearly depending on the scale of analysis.
When spatial variation becomes more visible, geographers may reach different conclusions about causes or implications. Between definition blocks, it is important to highlight how scale sensitivity improves analytical accuracy.
Interpreting Data Differently at Different Scales
Interpretation changes because scale shapes the story the data tells. Large-scale patterns may suggest broad global processes, such as economic inequality, while smaller-scale patterns may highlight local factors, such as zoning or neighborhood characteristics.
Global Scale Interpretation
At the global level, data show overarching patterns that can reveal:
Broad economic divides (e.g., core vs. periphery)
Worldwide demographic shifts
Generalized climate trends
Global transportation or communication networks
However, global-scale data hide internal variations within countries or regions.
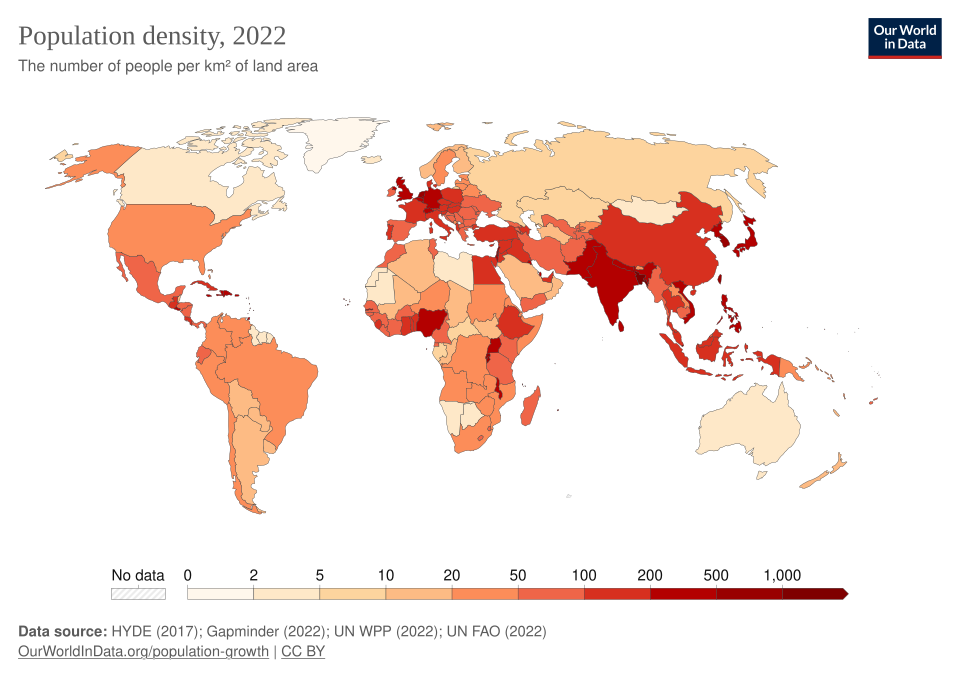
This choropleth map displays global population density patterns, with darker colors indicating more densely populated areas. It highlights broad worldwide trends while masking local variations. The inclusion of 2022 density values adds detail beyond the syllabus but helps illustrate the concept of global-scale analysis. Source.
Regional Scale Interpretation
Regional scales highlight how groups of countries or states share patterns that differ from surrounding areas. These patterns may include:
Shared linguistic or cultural traits
Similar demographic transitions
Regional political alignments
Environmental or climatic zones
Regional analysis helps geographers identify clusters and emerging regional trends not visible globally.
National Scale Interpretation
At the national scale, geographers can analyze:
Policy impacts on population or economic patterns
Internal migration
Regional development inequalities within states
National-level political behavior
National data can obscure significant local-level variations within states, provinces, or cities.
Local Scale Interpretation
Local scales provide the most detailed perspective and may reveal:
Neighborhood demographic differences
Variations in access to services and resources
Land-use patterns and zoning effects
Highly localized cultural landscapes
Local data often challenge generalized assumptions derived from larger-scale patterns.
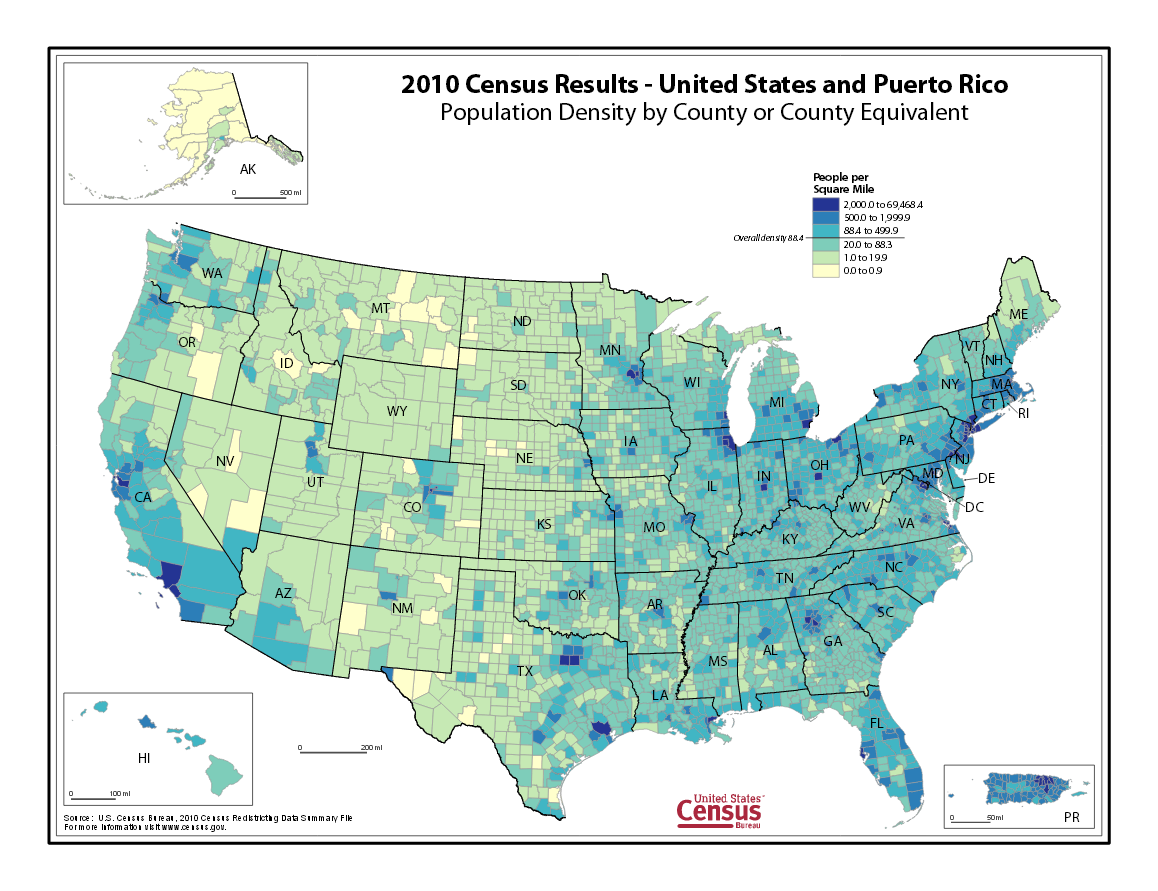
This map shows population density for every U.S. county, revealing fine-grained spatial differences that national-scale averages obscure. Dense metropolitan corridors and sparsely populated rural regions become clearly visible. Insets and precise density classes exceed syllabus requirements but strengthen understanding of local-scale variation. Source.
The Importance of Changing Scales in Geographic Inquiry
Because geographic processes often operate at multiple scales simultaneously, geographers routinely shift between scales to build stronger explanations. This multi-scalar perspective ensures that interpretations account for both broad trends and fine details. Changing scales can affirm or contradict earlier conclusions, prompting more precise analysis.
Scale of Analysis: The level at which data are aggregated and examined—global, regional, national, or local—which directly shapes observed patterns and interpretations.
A sentence between definitions is required to ensure clarity: recognizing the role of scale helps students critically evaluate geographic representations and avoid assumptions based on incomplete data.
Using Scale to Evaluate Variation and Interpretation
Scale helps geographers:
Identify hidden spatial variation
Recognize misleading aggregations
Understand how different patterns interact
Evaluate the reliability of geographic generalizations
Examine how political, economic, or cultural processes differ across space
The Role of Scale in Map Interpretation
When analyzing maps, changing scales can expose:
Clusters or dispersions invisible at other scales
Patterns of inequality or concentration
Spatial relationships between phenomena
New or contrasting interpretations
Scale determines the degree of detail displayed, and therefore the types of conclusions that can be drawn.
Linking Scale to Geographic Decision-Making
Policy makers, businesses, and planners use scale intentionally because different decisions require different levels of detail. For example:
National governments use national-scale data for broad planning.
City governments require local-scale data for zoning and resource distribution.
International organizations rely on global-scale datasets.
Understanding how patterns shift across scales ensures that decisions reflect accurate interpretations of geographic information.
Practice Questions
Question 1 (1–3 marks)
Explain how a geographic pattern might appear differently when analysed at the global scale compared with the local scale.
Question 1
Award up to 3 marks.
1 mark for identifying that different scales reveal different levels of detail.
1 mark for explaining that global-scale patterns may hide local variation or outliers.
1 mark for giving a clear example or elaboration, such as noting that a country may appear uniformly populated at a global scale but highly varied at a local scale.
Question 2 (4–6 marks)
Using your knowledge of geographic scales of analysis, discuss how changing the scale can influence the interpretation of population data. In your answer, refer to both variation and the implications for geographic conclusions.
Question 2
Award up to 6 marks.
1 mark for identifying that scale affects how population patterns are perceived.
1 mark for explaining that larger scales (e.g., global or national) aggregate data, masking internal variations.
1 mark for explaining that smaller scales (e.g., regional or local) reveal fine-grained variation.
1 mark for linking changes in scale to different interpretations or conclusions (e.g., identifying inequality, clustering, or contrasting trends).
1 mark for referring explicitly to variation in the data.
1 mark for explaining implications for geographic understanding, such as policy decisions or misinterpretation due to data aggregation.
FAQ
Geographers choose the scale that best aligns with the spatial extent of the phenomenon they want to understand. If the process operates globally, such as climate migration trends, a large scale is suitable; if it operates within neighbourhoods, a local scale is more relevant.
They also consider data availability, the purpose of the investigation, and whether multiple scales might be needed to reveal hidden variation.
Different scales aggregate data in different ways, which can highlight or obscure spatial patterns. A trend that appears strong nationally may weaken or reverse at the regional or local scale because smaller units reveal exceptions, clusters, or outliers.
These contradictions often arise because spatial processes rarely operate uniformly across all areas.
Scale determines how visible inequality is. At a national scale, broad averages may make a country seem relatively equal, but examining smaller units can reveal concentrated deprivation or wealth.
Key inequalities often emerge only at detailed scales where local conditions—such as access to services or employment opportunities—become visible.
Cartographers use generalisation to simplify features at smaller scales and reduce visual clutter. They may adjust symbol sizes, merge small features, or alter classification methods to maintain clarity.
While these choices improve readability, they can also influence interpretation by altering how patterns appear.
Comparing patterns across several scales helps geographers confirm whether a trend is consistent or scale-dependent. This approach reduces the risk of misleading conclusions drawn from a single level of analysis.
It also allows researchers to identify interactions between global forces and local conditions, offering a more comprehensive understanding of spatial processes.
