
AP Syllabus focus:
‘Sex ratios vary across regions and may be mapped and analyzed to compare population composition at different scales.’
Sex ratio patterns reveal how populations are structured, reflecting biological, social, cultural, and economic forces. Understanding these variations helps geographers interpret demographic dynamics and regional population differences.
Understanding Sex Ratio Patterns
The sex ratio—the number of males per 100 females—offers insight into how demographic forces shape population composition. Because sex ratios differ globally, regionally, and locally, geographers analyze these patterns across multiple scales to understand why some places have more men, more women, or relatively balanced populations.
Sex Ratio: The number of males per 100 females in a population, used to assess population balance and demographic trends.
Sex ratios matter because they influence labor markets, family structures, marriage patterns, and long-term demographic change. Regional variation is shaped by biological factors, social practices, and migration flows.
Biological Foundations of Sex Ratios
Human populations naturally tend to have slightly more males than females at birth. Biological norms produce a sex ratio at birth close to 105 males per 100 females in most societies. However, real-world ratios frequently deviate from this norm due to cultural, health-related, or political conditions influencing survival and life expectancy for different genders.
Sex Ratios Across Scales of Analysis
The syllabus emphasizes that sex ratios vary across regions and may be mapped and analyzed at different scales, making scale a core component of geographic interpretation.
Global Patterns
Worldwide, sex ratios display consistent broad trends, shaped by large-scale demographic forces.
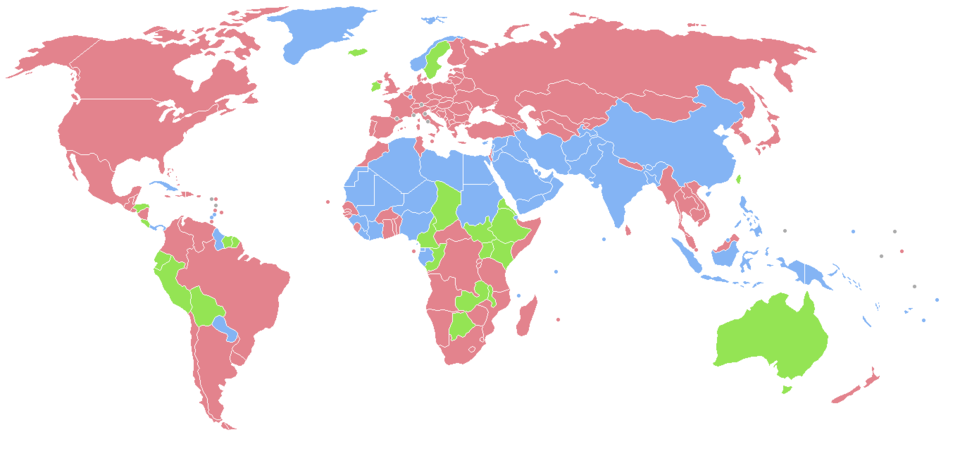
World map showing the sex ratio of the total population by country, with colors indicating whether males, females, or neither sex predominates numerically. This visualization illustrates how sex ratios vary across world regions, supporting geographic comparison at a global scale. Some regions show male-heavy or female-heavy populations, while others remain relatively balanced. Source.
At birth, most regions align with the biological norm.
Adult populations show more variation due to migration, conflict, and gendered differences in longevity.
Older age groups typically have more females because women generally live longer than men.
Regional Patterns
Regional sex ratios reveal the interaction of demographic processes with cultural and economic systems.
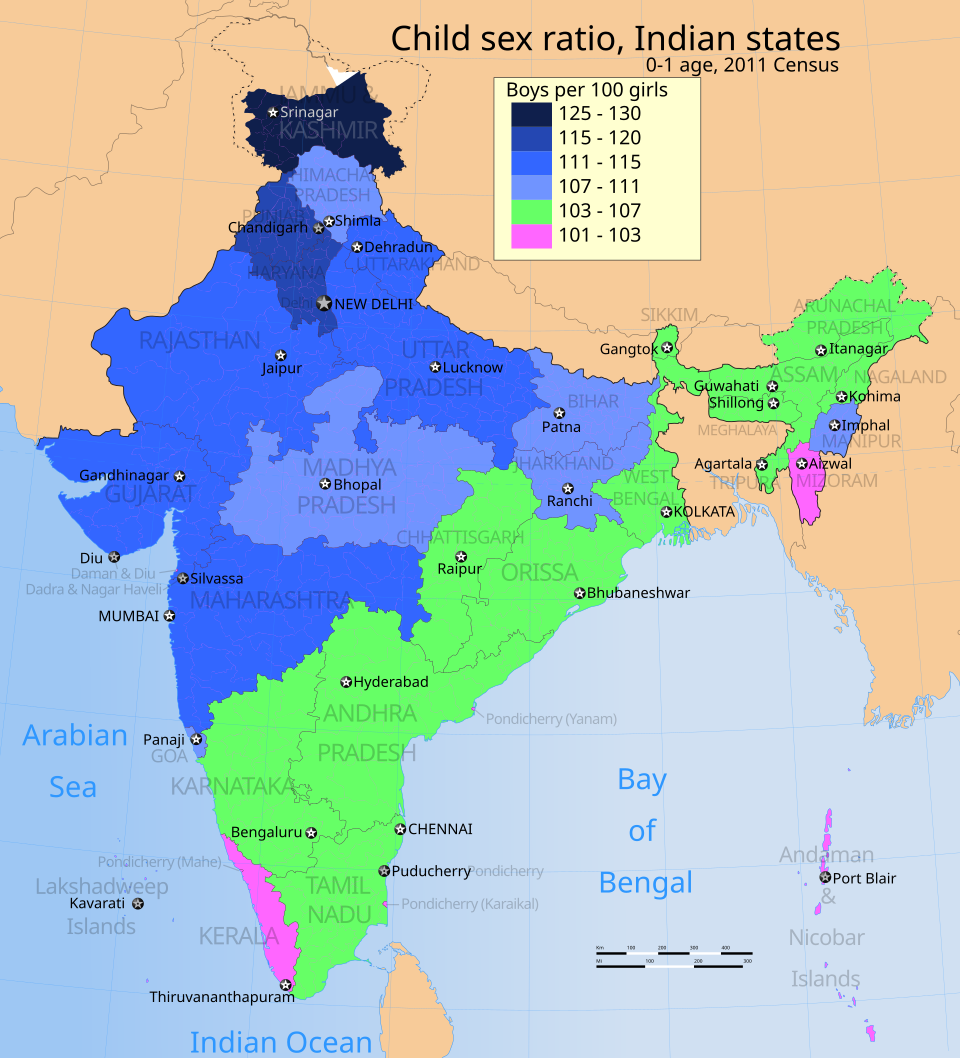
Map of child sex ratios in India’s states and union territories, showing the number of boys per 100 girls (ages 0–1) according to the 2011 Census. The darkest shades indicate the most male-skewed populations, reflecting the influence of cultural norms and regional demographic dynamics. The map appears within a wider discussion of female foeticide, which extends beyond the AP requirement but still illustrates subnational spatial variation in sex ratios. Source.
Some regions demonstrate male-biased populations due to migration for labor or cultural preferences for sons. Others show female-majority populations, often where aging populations dominate or where conflict has disproportionately affected men.
National and Subnational Patterns
At the national level, sex ratios can differ significantly depending on government policies, economic structures, and historic trends. Subnational mapping reveals even more localized patterns, such as:
Regions with large universities showing more female young adult populations.
Mining or industrial zones showing heavily male working-age populations.
Rural–urban differences shaped by migration opportunities for specific genders.
Factors Influencing Sex Ratio Patterns
Sex ratios are not static; numerous forces influence whether populations skew male, female, or balanced.
Cultural and Social Factors
Cultural expectations and gender norms strongly affect sex ratios. In some societies, strong preferences for sons have historically influenced decisions around family planning, leading to skewed ratios. Social roles and expectations also influence men’s and women’s participation in migration and labor markets.
Economic Forces
Economic opportunities often shape gendered migration flows, which in turn alter local sex ratios.
Labor migration drawing male workers into construction, resource extraction, or international work can create male-heavy populations in receiving areas.
Service-sector economies may attract more female workers, shifting a region toward female-majority populations.
Political and Historical Influences
Policies, conflict, and state-level decisions can impact sex ratios.
Historical conflicts have often lowered the number of men in a population due to higher male mortality.
Immigration policies targeting specific labor sectors may prioritize one gender over another.
Public health strategies influence life expectancy and survival rates, impacting long-term sex ratio patterns.
Mapping and Analyzing Sex Ratios
Geographers rely on mapping to visualize how sex ratios vary across space and scale. This spatial analysis helps reveal underlying demographic processes. Mapping sex ratios can identify:
Clusters of male-dominated or female-dominated areas.
Regions undergoing rapid social change due to migration or economic restructuring.
The spatial effects of cultural preferences or state policies.
Interpreting Patterns Using Spatial Data
Spatial analysis helps geographers connect demographic statistics to broader human geography concepts. When analyzing maps of sex ratios, geographers consider:
Scale: Whether patterns appear at global, regional, national, or local levels.
Context: The cultural, political, and economic environment surrounding the demographic data.
Temporal change: How sex ratios shift over time as social roles and demographic trends evolve.
Age Structure and Sex Ratios
Sex ratios vary significantly by age group.
Younger cohorts may show male-heavy distributions due to biological norms or parental preference.
Working-age cohorts often reflect migration flows that differ by gender.
Older cohorts tend to have more women because of longer female life expectancy.
These age-specific variations contribute to a population’s overall composition and can reveal underlying demographic pressures.
The Significance of Sex Ratio Patterns in Human Geography
Sex ratio patterns help explain a wide range of geographic phenomena, making them essential to understanding human populations. They influence:
Marriage markets and household formation.
Labor force composition and economic development.
Social services demand, such as elderly care in female-majority aging populations.
Migration pressures and gendered labor mobility.
Analyzing sex ratios across scales provides insight into how demographic processes shape societies and how cultural, economic, and political systems affect population composition.
Practice Questions
(1–3 marks)
Explain what is meant by the term "sex ratio" in population geography.
Question 1 (1–3 marks)
1 mark: Identifies that sex ratio is a comparison or proportion of males and females in a population.
2 marks: States that it is usually expressed as the number of males per 100 females.
3 marks: Provides both the definition and a clear indication of its use in analysing population composition.
(4–6 marks)
Using examples, explain two factors that can lead to regional variations in sex ratios. Your answer should refer to differences between places or scales.
Question 2 (4–6 marks)
1 mark: Identifies one factor influencing variations in sex ratios (e.g., migration, cultural preferences, conflict, economic structures).
2 marks: Identifies a second distinct factor.
3–4 marks: Provides explanation of how each factor affects sex ratios in different regions or at different scales.
5–6 marks: Uses relevant examples (may be countries, regions, or local areas) and clearly links them to variations in sex ratios, showing strong geographic reasoning.
FAQ
Sex ratios can reveal whether a region is attracting predominantly male or female migrants. A surplus of young adult males may indicate labour migration to construction, mining, or industrial sectors, while a surplus of young adult females may suggest growth in service-sector employment.
These patterns help geographers identify how economic opportunities influence gendered mobility, and how migration flows reshape a region’s demographic structure over time.
Large imbalances often appear in:
Rapidly industrialising areas drawing male labour
Ageing regions with disproportionately older female populations
Areas experiencing conflict, where male mortality increases
Regions with a historical cultural preference for sons
These settings reflect how social norms, economic roles, and political instability impact demographic composition.
Urban areas frequently draw migrants seeking employment, often skewing ratios if one gender moves more readily. For example, males may migrate to cities for industrial or construction work, altering urban balances.
Rural areas may retain more females or elderly populations, especially where younger men migrate out for economic opportunities. The contrast highlights how internal migration reshapes demographic patterns at the subnational scale.
Women generally live longer than men, particularly in high-income regions, resulting in female-majority older cohorts. This produces a more balanced sex ratio in younger groups but a shift toward female dominance in populations over 65.
These patterns help geographers interpret pressures on health care systems, retirement structures, and elderly support networks.
A strongly male-biased ratio may reflect cultural norms valuing sons, unequal access to health services, or selective migration linked to labour markets.
A female-majority ratio might indicate higher male mortality, out-migration of working-age men, or an ageing population dominated by older women.
Extreme imbalances often signal deeper social issues, such as gender discrimination, economic inequality, or the long-term demographic impacts of conflict.
