
AP Syllabus focus:
‘Patterns of age structure vary across regions and may be mapped and analyzed at different scales.’
Age structure patterns show how populations are divided by age, revealing demographic trends, development levels, and future challenges that shape social, economic, and political processes globally.
Age Structure Patterns
Age structure refers to the distribution of a population across different age groups, typically divided into young dependents, working-age adults, and older dependents. Understanding these patterns helps geographers analyze population dynamics, compare regions, and explain how demographic characteristics shape places at multiple scales. Because patterns vary across regions, age structure provides valuable insight into fertility, mortality, development, and future population change.
Key Components of Age Structure
Age structure is commonly illustrated using proportionate age groups that reveal demographic behavior and social pressures.
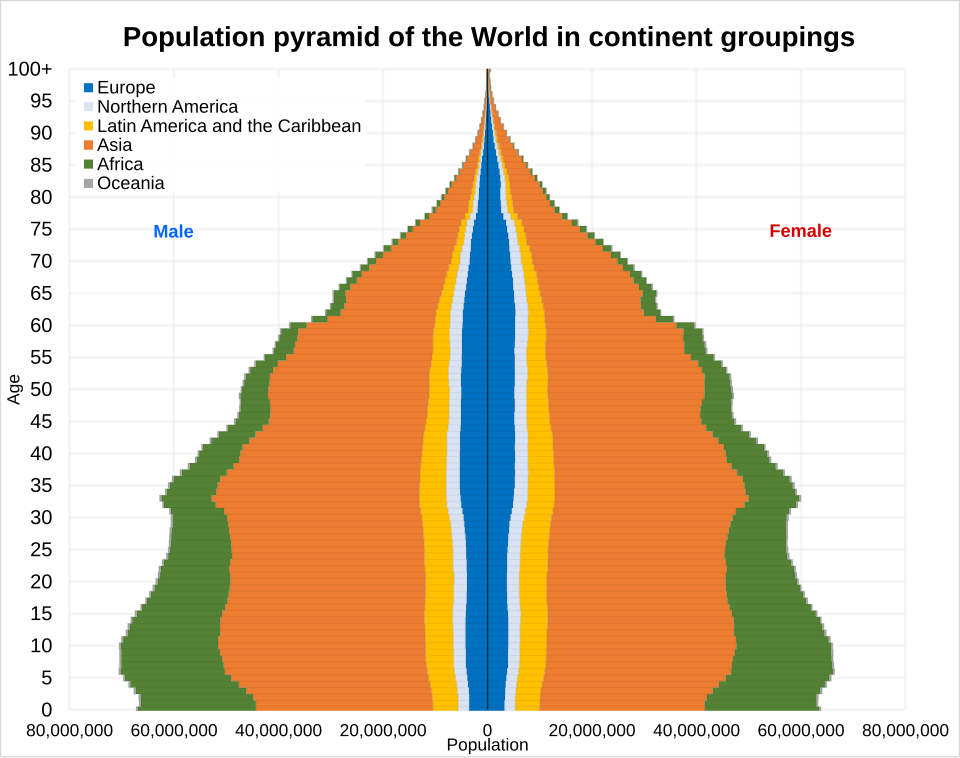
This diagram presents population pyramids for major world regions, allowing direct comparison of age structures across continents. Regions with broad bases, such as Africa, have youthful populations, while regions with thicker upper bars, such as Europe, show older populations and more pronounced aging. The figure follows United Nations regional groupings, adding detail beyond the syllabus while supporting analysis of regional demographic contrasts. Source.
The most frequently used age categories include:
0–14 years: often called young dependents.
15–64 years: typically the working-age population.
65+ years: commonly referred to as older dependents.
These groupings allow for comparative analysis across different places and times, forming the basis for demographic indicators such as dependency ratios and potential societal pressures.
Understanding Age Structure Through Demographic Indicators
A population’s age structure is strongly connected to patterns in fertility, mortality, and life expectancy. Because these underlying demographic forces differ widely across regions, age structures also vary.
For example:
Regions with high fertility tend to have broad bases of young people.
Regions with low fertility and longer life expectancy tend to have larger elderly populations.
Areas with significant migration flows, especially labor migration, may show distortions in certain age groups, especially younger adult males.
This variation enables geographers to map and analyze global, regional, national, and local differences in demographic composition.

This map depicts global variation in median age, with lighter colors marking youthful populations and darker colors marking older populations. Sub-Saharan Africa appears prominently youthful, while Europe and East Asia contain older populations. Exact numerical ranges are included, offering additional quantitative detail beyond the syllabus while supporting geographic comparisons of age structure. Source.
Mapping and Analyzing Age Structure at Different Scales
Global Scale Patterns
At the global level, broad contrasts in age structure reflect differences in economic development and demographic transitions.
Many Sub-Saharan African countries show youthful age structures due to historically high fertility and lower life expectancy.
Europe and East Asia exhibit aging populations resulting from prolonged low fertility and increased longevity.
Rapidly developing regions in South and Southeast Asia show transitional structures, with shrinking youth cohorts and growing adult and elderly populations.
These global contrasts highlight varying levels of development and future demographic pressures such as labor shortages or youth dependency burdens.
Regional and National Scale Patterns
Age structure becomes even more meaningful when examined at regional or national scales, where internal demographic differences emerge.
Within a single country:
Urban areas often have larger young-adult populations attracted by employment and education opportunities.
Rural regions may show higher proportions of children due to traditional fertility patterns.
Certain areas may have disproportionate numbers of older adults because of aging-in-place or youth out-migration.
These differences influence local planning needs and resource allocation.
Local Scale Patterns
At the local scale, age structure reflects immediate social realities and community-level patterns.
Examples include neighborhoods with:
High concentrations of families with children, increasing demand for schools and childcare.
Large proportions of retirees, shaping healthcare, housing, and transportation needs.
College towns with significant numbers of young adults, influencing housing markets and labor patterns.
Because patterns vary with the scale of analysis, geographers must interpret age structure data carefully, recognizing that local patterns may differ significantly from national or global averages.
Factors Influencing Age Structure Patterns
Demographic Factors
Age structure is directly shaped by:
Fertility rates, which determine the size of the youngest cohorts.
Mortality rates, which influence survival into older age groups.
Life expectancy, which affects the proportion of elderly individuals.
Higher fertility produces youthful populations, while low fertility combined with longer life expectancy results in aging populations.
Migration Patterns
Migration can dramatically reshape specific age groups.
Key influences include:
Labor migration, which often increases the young adult population in receiving regions.
Out-migration of youth, which can leave rural or economically struggling regions with aging populations.
Refugee movements, which may alter age distributions depending on who is displaced.
While fertility and mortality shape long-term demographic structure, migration can shift patterns more rapidly.
Economic and Social Context
Economic opportunities, cultural expectations, and government policies also affect age structures.
Regions experiencing economic growth often attract working-age adults.
Societies with cultural norms favoring larger families sustain broader young populations.
Policies supporting childcare, parental leave, and gender equality can influence fertility patterns, slowly reshaping age structure over time.
Recognizing these influences helps explain why two regions at similar development levels may still display different demographic profiles.
Implications of Age Structure Patterns
Age structure is not only descriptive—it affects how societies function. Differences in the proportion of children, working-age adults, and elderly residents shape:
Labor force availability
Healthcare demands
Education needs
Pension systems
Government spending priorities
Future population growth trajectories
Because these patterns vary across regions and scales, geographers use age structure analysis to anticipate future demographic challenges and opportunities.
Understanding these spatial variations allows students to connect population composition with broader geographic processes, reinforcing why age structure is essential in demographic analysis at every scale.
Practice Questions
Question 1 (1–3 marks)
Using the concept of age structure, explain one reason why a country with a youthful population may face increased pressure on public services.
Mark scheme
1 mark for identifying a relevant pressure (e.g., increased demand for schools, childcare, or basic healthcare).
1 mark for explaining how a youthful age structure leads to this pressure (e.g., a high proportion of dependants requires more educational infrastructure).
1 mark for providing an additional detail or clear real-world link (e.g., governments may need to allocate more funding to primary education or vaccination programmes).
Question 2 (4–6 marks)
Analyse how age structure patterns can vary between regions at different scales, and explain two factors that may contribute to these variations.
Mark scheme
1–2 marks for describing variations in age structure at different scales (e.g., global contrasts such as youthful Africa versus ageing Europe; national contrasts such as rural ageing versus urban young-adult concentrations).
1–2 marks for identifying two relevant contributing factors (fertility, mortality, migration, or economic context).
1–2 marks for explaining how each factor influences age structure (e.g., high fertility broadens the base of the age structure; labour migration increases the proportion of working-age adults in receiving regions).
FAQ
Age structure indicates the proportion of people entering, currently in, or leaving the workforce. A population with many young adults suggests future growth in job seekers, creating potential competition or economic expansion depending on job availability.
An ageing population signals a shrinking labour pool, increasing demand for immigration or automation to sustain economic productivity.
Governments often use these patterns to plan training programmes, pension reforms, and workforce policies.
Remote areas may experience selective out-migration of young adults seeking education or employment, leaving behind older adults and children.
These areas also tend to have:
Limited access to healthcare or services, which can affect life expectancy
Lower in-migration due to fewer economic opportunities
As a result, their age structures often appear older or more imbalanced than national figures.
Governments respond to the dominant age groups in their population. A youthful population boosts demand for education funding, affordable housing, and job creation.
Ageing populations shift political priority towards pensions, healthcare, and age-friendly infrastructure.
In regions with contrasting age structures, political debates often reflect competition between generational needs and resource distribution.
Cultural expectations around family size directly influence fertility rates, shaping the proportion of children in the population. Extended-family living arrangements can also support higher fertility by sharing childcare responsibilities.
Societies that value smaller families, late marriage, or prolonged education tend to develop narrower youth cohorts.
These cultural elements cause noticeable regional differences even among areas at similar economic levels.
Environmental stressors such as drought, pollution, or natural hazards can push younger populations to migrate towards safer or more prosperous areas.
Older adults may be more likely to remain due to attachment to place, property ownership, or reduced mobility.
In areas where environmental conditions support stable agriculture or industry, younger families often remain, producing youthful age structures.
