
AP Syllabus focus:
‘An aging population affects the dependency ratio, changing the balance between working-age people and dependents.’
Aging populations reshape national demographic structures by altering the balance between dependent and working-age groups, influencing economic productivity, service needs, and long-term population sustainability in diverse global contexts.
Understanding the Dependency Ratio
The dependency ratio is a core demographic measure used by geographers to assess how many people rely on the working-age population for economic and social support. As populations age, this ratio changes, revealing how demographic shifts affect labor markets, government spending, social services, and long-term development prospects. Because aging generally results from declining birth rates, rising life expectancy, and shifting mortality patterns, it directly influences the share of dependents and the overall pressures placed on societies.
Dependency Ratio: A measure comparing the size of a population’s dependent groups—typically children and older adults—to its working-age population.
One important aspect of this concept is that it allows geographers to compare demographic burdens across countries and regions, even when population sizes differ. Rising aging ratios often signal increased demands on health care, pensions, and long-term care systems, while simultaneously shrinking the labor force that supports them financially.
Categories of Dependents
Dependents are generally divided into two major groups because each contributes differently to demographic pressures and policy needs.
Young Dependents
Young dependents are commonly defined as people aged 0–14. Their dependency reflects the economic and social obligations required for child care, education access, and household support. A population with a high share of young dependents is typically associated with higher fertility rates, limited access to contraception, or cultural norms that favor larger families. These patterns create distinctive long-term pressures such as the future need for employment opportunities and educational infrastructure.
Elderly Dependents
Elderly dependents, often people aged 65 and older, reflect the demographic reality of increased life expectancy and declining fertility. As aging accelerates, these dependents place greater pressure on medical systems, specialized housing, and social welfare programs. The proportion of elderly dependents is especially significant in high-income countries, where prolonged life spans and reduced birth rates have reshaped population compositions. In some regions, the elderly dependency ratio is expanding faster than overall population growth.
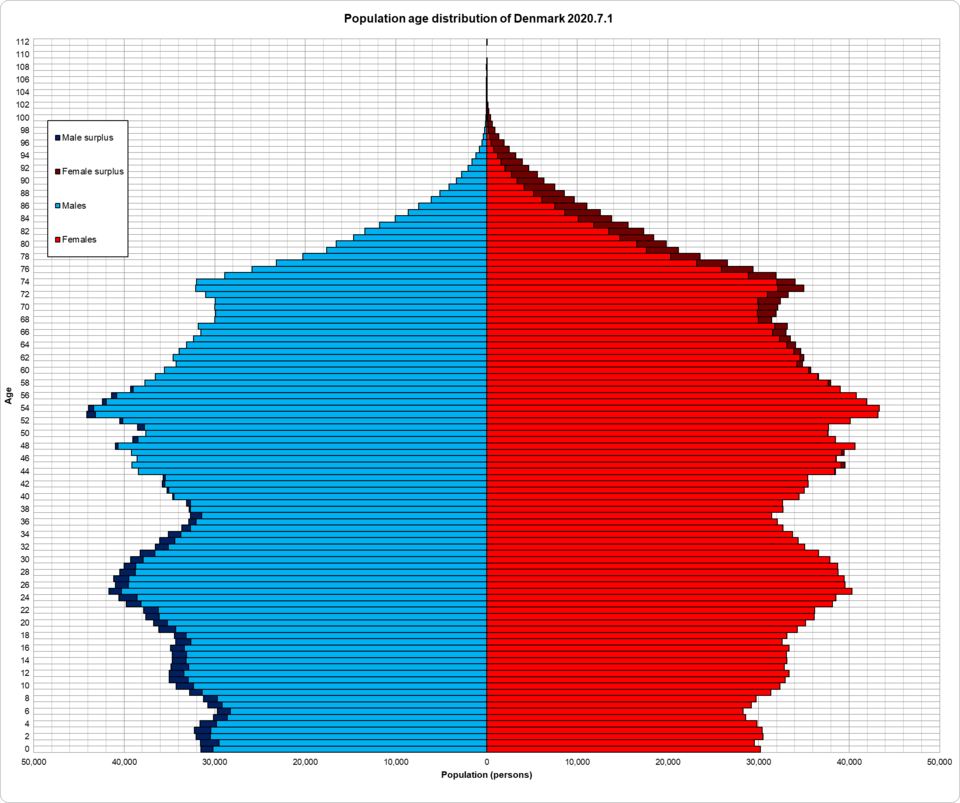
This population pyramid for Denmark in 2020 shows a relatively narrow base of young ages and a broader set of older cohorts, typical of an aging, low-fertility society. It helps illustrate how a large share of people aged 65+ increases the elderly dependency ratio and raises pressure on working-age groups. The figure also displays age distribution by sex, which extends beyond but supports the demographic concepts discussed. Source.
Measuring the Dependency Burden
Rates of dependency are typically analyzed to evaluate how demographic balances influence economic potential and planning requirements. Geographers use these ratios to understand the ways changing population structures alter national and regional capacity to sustain social services. A high dependency burden means a smaller proportion of workers supports a larger number of dependents, often requiring governments to adjust fiscal policies, pension systems, and public spending priorities.
= Young dependents
= Elderly dependents
= Working-age population
This equation highlights the relative size of dependent groups compared to those most likely to be economically active. The ratio is usually expressed as the number of dependents per 100 working-age individuals. Geographers also analyze the total dependency ratio, youth dependency ratio, and elderly dependency ratio separately to understand which dependent group contributes more to demographic strain.
Aging and Shifts in Dependency Ratios
Declining Birth Rates
Falling fertility reduces the proportion of young dependents while increasing the long-term likelihood of an aging population. As fewer children are born, the overall dependency structure shifts away from youth dependency toward elderly dependency. This transition is common in post–industrial societies that experience improved education, rising female workforce participation, and greater access to reproductive health care.
Increased Life Expectancy
Rising life expectancy expands the size of the elderly population, increasing the elderly dependency ratio even when overall population numbers remain stable. Improvements in health care, sanitation, nutrition, and chronic disease management contribute to longer life spans. These factors create a demographic situation where more people survive beyond working age, intensifying the dependency burden.
Impacts on the Working-Age Population
Changes in dependency ratios profoundly affect the working-age population, which must support dependents through productivity, taxes, and caregiving labor. When elderly dependency rises, the demand on employed adults intensifies, potentially reducing disposable income and increasing the need for elder care resources. When youth dependency is high, families and governments must allocate more resources to education and health services. In both cases, demographic pressures shape national priorities.
Geographic Variation in Aging and Dependency
Rates of aging and dependency vary widely across different scales.
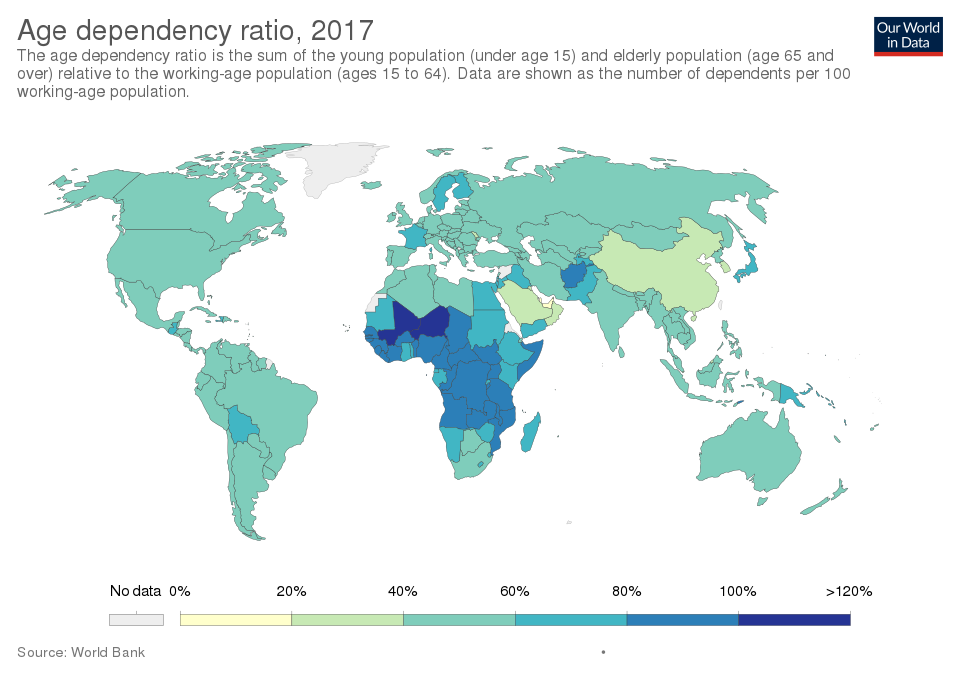
This world map displays age dependency ratios worldwide in 2017, highlighting regions with larger dependent populations relative to working-age adults. It visually reinforces the concept of geographic variation in dependency burdens and illustrates why some countries face greater demographic pressure. The map includes both young and elderly dependents together, providing broader context than required but still directly relevant. Source.
At the global level, high-income countries generally face higher elderly dependency ratios due to prolonged economic and public health development. Middle- and low-income countries often exhibit high youth dependency, influenced by higher fertility and shorter life expectancy. At regional and national scales, migration patterns, cultural norms, economic structure, and public policy all contribute to uneven aging trends. Understanding these variations helps geographers evaluate how demographic structures shape resource needs, development challenges, and social policy decisions.
Practice Questions
Question 1 (1–3 marks)
Explain what the dependency ratio measures in a population.
Mark scheme:
• 1 mark for stating that it compares dependents to the working-age population.
• 1 mark for identifying which age groups are typically considered dependents (children and the elderly).
• 1 mark for noting that it indicates the level of economic or social pressure placed on the working-age group.
Question 2 (4–6 marks)
Using examples, explain how an ageing population can affect the dependency ratio and outline two consequences this may have for a country.
Mark scheme:
• 1 mark for recognising that an ageing population increases the proportion of elderly dependents.
• 1 mark for correctly linking this to a higher elderly dependency ratio.
• 1 mark for explaining how increasing life expectancy or falling birth rates contribute to this pattern.
• 1–2 marks for describing consequences such as increased pressure on healthcare systems, pension costs, labour shortages, or changes in taxation.
• 1 mark for including a relevant example illustrating how a country is affected by population ageing (e.g., Japan, Italy, Germany).
FAQ
In countries with high youth populations, a high dependency ratio often signals future pressure on education systems and the need for job creation as large cohorts enter adulthood.
In countries with high elderly populations, the same ratio highlights increased demand for pensions, healthcare, and long-term support services.
Although the ratio may be similar numerically, the types of services and economic strategies required differ substantially depending on whether youth or elderly dependents dominate.
A declining population does not reduce the number of older adults who are already past working age.
At the same time, falling birth rates and out-migration of young workers shrink the working-age population more quickly than the elderly population reduces through mortality.
This imbalance makes the elderly dependency ratio rise even when the overall population size is stable or falling.
Policies influenced include:
• Retirement age adjustments to maintain a larger working-age population.
• Pension reforms to manage financial pressure from increasing elderly dependents.
• Family support schemes aimed at easing childcare and boosting labour participation.
Countries also use labour migration policies to address shortages when dependency ratios rise sharply.
Most migrants are young adults of working age, so inward migration typically reduces the dependency ratio by increasing the size of the labour force.
Outward migration of younger adults has the opposite effect, leaving behind a population with a higher share of elderly or child dependents.
Large-scale conflict-driven or economic migration can therefore significantly change the balance of dependents within only a few years.
Dependency ratios do not reveal the absolute number of dependents, only the proportion relative to the working-age group. Countries with larger overall populations may therefore experience greater total pressure on services.
The economic capacity of the working-age population—such as income levels, productivity, and taxation systems—also differs greatly.
As a result, countries with the same ratio may face very different challenges depending on the strength of their institutions, welfare systems, and labour markets.
