
AP Syllabus focus:
‘Population aging is determined by birth rates, death rates, and life expectancy.’
Population aging reflects the shifting balance of age groups within a population as the proportion of older individuals increases.
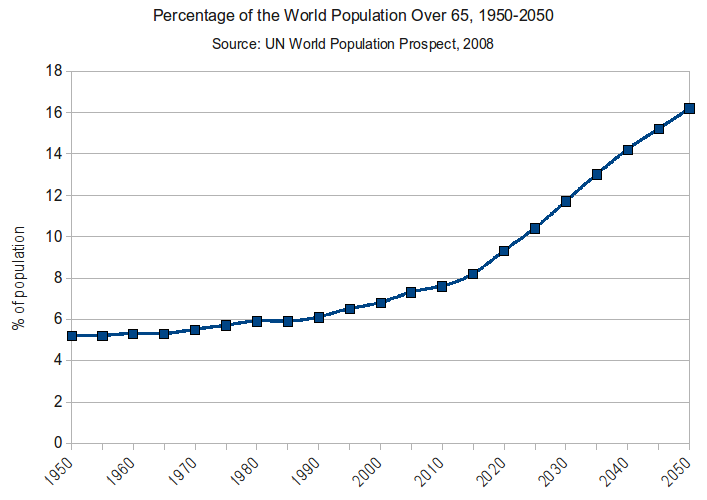
This chart displays the percentage of the world’s population aged 65 and older from 1950 to 2050. The upward trend illustrates global population aging as fewer births and longer life expectancy increase the share of older adults. The right-hand portion of the line represents UN projections beyond the present, providing additional forward-looking context. Source.
It emerges from long-term demographic trends that alter the relative size of younger and older cohorts.
Core Demographic Drivers of Population Aging
Population aging results directly from changes in birth rates, death rates, and life expectancy, which together shape the age structure of a society. These demographic forces operate over decades, gradually transforming population composition at local, national, and global scales.
Declining Birth Rates
Lower birth rates, also called crude birth rates (the number of live births per 1,000 people per year), are one of the most powerful contributors to population aging.
Crude Birth Rate: The number of live births per 1,000 people in a population per year.
When birth rates fall, fewer children enter the population, shrinking the base of the age structure. This shift increases the proportion of older adults even if the number of elderly people does not initially grow. Several forces commonly drive declining birth rates:
Economic development, which often increases the cost of raising children and shifts household priorities toward education and careers.
Urbanization, where smaller living spaces and higher expenses reduce family size.
Increased female education and labor force participation, influencing reproductive choices.
Greater access to contraception, allowing families to plan and delay births.
Lower birth rates set the stage for long-term population aging by reducing the replacement rate of younger generations.
Decreasing Death Rates
Population aging also emerges when death rates decline, allowing more individuals to survive into older age. A declining crude death rate indicates improved living conditions, access to health care, and reductions in diseases that previously limited life spans.
Crude Death Rate: The number of deaths per 1,000 people in a population per year.
Falling death rates reshape age composition in several important ways:
More people survive childhood and adulthood, increasing the number who reach old age.
Chronic and degenerative diseases replace infectious diseases as leading causes of death, aligning with the epidemiological transition.
Public health improvements, such as clean water, vaccination, and sanitation, extend life expectancy across populations.
Although declining death rates affect all age groups, the most visible impact is the growth of older age cohorts.
Rising Life Expectancy
Increasing life expectancy, defined as the average number of years a person can expect to live given current mortality patterns, is a central driver of population aging.
Life Expectancy: The average number of years an individual is expected to live based on current mortality trends.
Life expectancy rises when societies experience health improvements and reduced mortality at multiple stages of life. Key factors include:
Advances in medical technology, such as antibiotics, surgical procedures, and treatments for chronic illnesses.
Expanded access to health care, allowing early detection and management of disease.
Nutritional improvements, raising immunity and lowering health risks.
Declines in maternal and infant mortality, which lift overall life expectancy substantially.
Higher life expectancy increases the number of people living into their 70s, 80s, and beyond, enlarging the elderly population relative to younger age groups.
Interactions Among the Three Drivers
Although birth rates, death rates, and life expectancy each influence aging independently, population aging most often results from their interaction over time. The combination of fewer young people entering the population and more older adults living longer amplifies the aging trend.
How These Forces Work Together
Low birth rates reduce the share of youth, shrinking the bottom of the population pyramid.
Low death rates expand the number of adults who survive into older age, adding weight to the top of the pyramid.
Longer life expectancy stretches the upper limits of age, increasing the proportion of very old individuals within the population.
These combined processes lead to a higher median age, a higher proportion of elderly dependents, and a shift in population structure that has significant implications for labor markets, social services, and economic planning—topics explored in surrounding subsubtopics of the AP syllabus.
Spatial and Temporal Variation in Aging
Population aging does not occur uniformly across regions. Because demographic change unfolds over decades, different countries experience aging at different times and intensities.
Global Variation
High-income countries often have the most advanced aging due to historically low birth rates and long life expectancy.
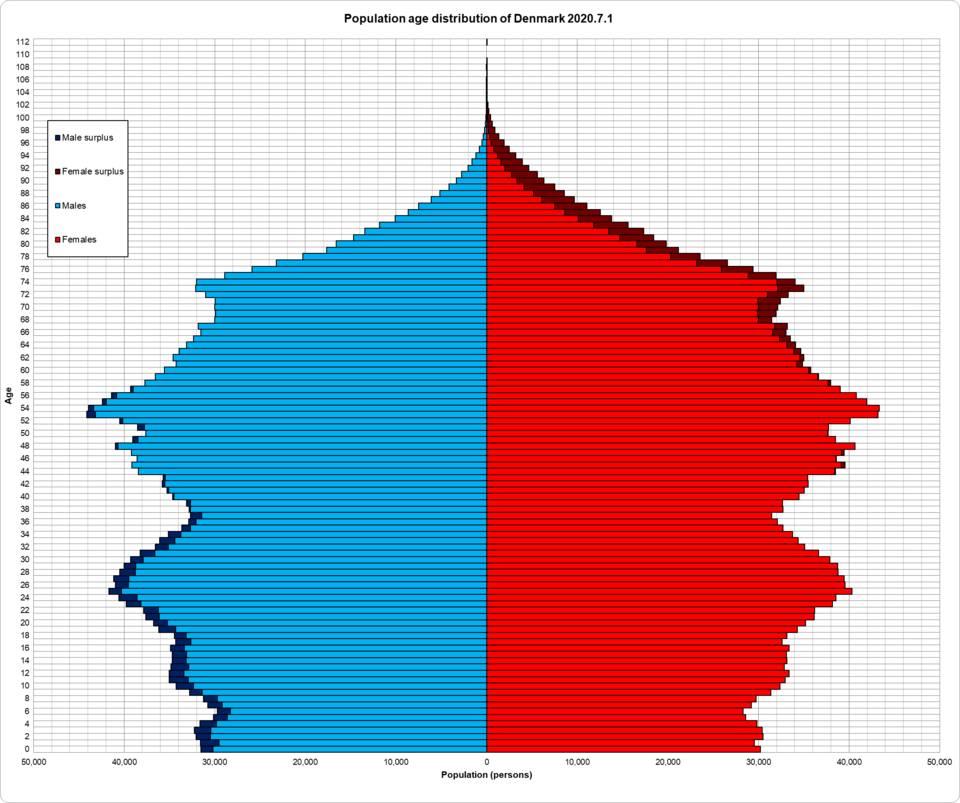
This population pyramid shows Denmark’s age–sex structure in 2020, with males in one color and females in another. The relatively narrow base and substantial proportion of older adults reflect low birth rates and high life expectancy, hallmarks of an aging population. The single-year age bars provide more detailed age breakdowns than required by the syllabus, but they visually reinforce how older cohorts make up a large share of the population. Source.
Middle-income countries are now experiencing rapid aging as fertility falls and health systems expand.
Low-income countries tend to have younger populations, but improvements in living standards are beginning to lower death rates and extend life expectancy, initiating aging processes.
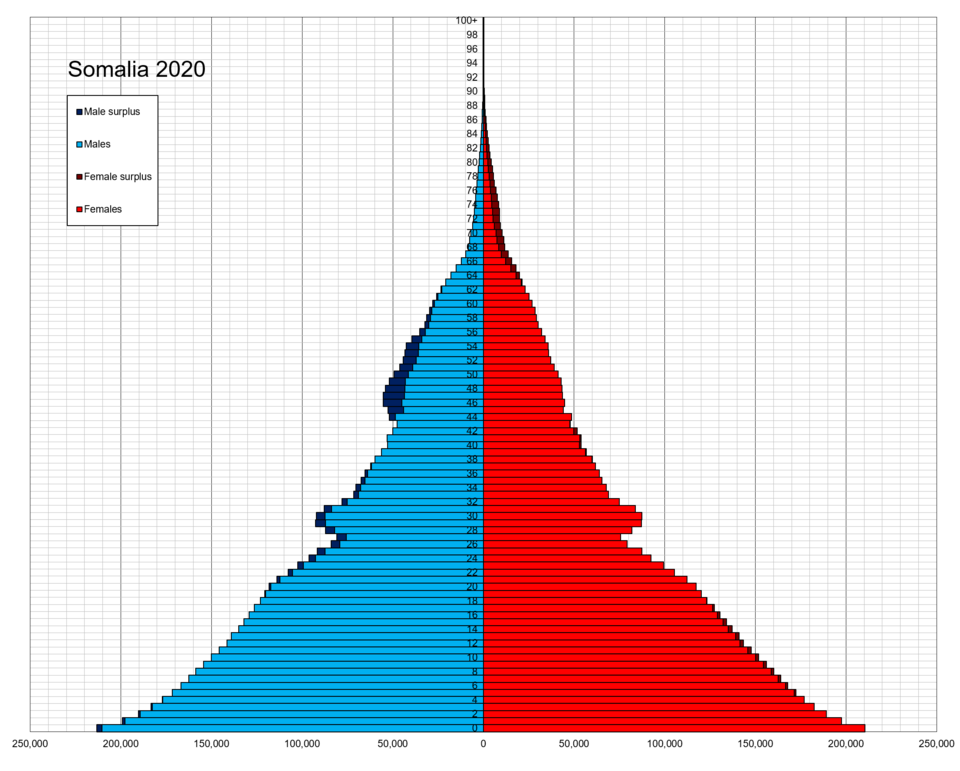
This population pyramid depicts Somalia’s age–sex structure in 2020. The wide base indicates high birth rates and a large share of children and young adults, while the narrow top reflects lower life expectancy and smaller elderly cohorts. The detailed single-year bars provide more granularity than the AP syllabus requires, but they clearly highlight how a youthful population differs from an aging one in shape. Source.
Scale and Patterns
Population aging can be observed at multiple spatial scales:
Local and regional scales, where migration patterns influence age composition (e.g., younger workers leaving rural areas).
National scales, where government policies and economic development shape fertility, mortality, and longevity.
Global scales, where demographic transitions progress at different stages across world regions.
Across all scales, the central forces remain consistent: birth rates, death rates, and life expectancy are the foundational demographic variables determining why populations age.
Practice Questions
Question 1 (1–3 marks)
Explain one way in which declining birth rates contribute to population ageing.
Mark scheme:
1 mark for identifying that lower birth rates reduce the proportion of young people in the population.
1 mark for explaining that fewer births narrow the base of the population pyramid or age structure.
1 mark for linking this change to an increased share of older age groups or a rise in the median age.
Question 2 (4–6 marks)
Using examples, analyse how changes in death rates and life expectancy together contribute to population ageing in a country.
Mark scheme:
1 mark for identifying that declining death rates allow more individuals to survive into older adulthood.
1 mark for describing how improvements in public health, medical care, or sanitation reduce mortality.
1 mark for defining or describing life expectancy as rising when people live longer on average.
1 mark for explaining how increased life expectancy enlarges older cohorts (e.g., more people living into their 70s or 80s).
1 mark for linking both processes to a shift in the population structure towards a higher proportion of elderly people.
1 mark for a relevant example (e.g., a high-income country where longevity is high, or a middle-income country experiencing rapid improvements).
FAQ
Population ageing usually unfolds over several decades because the effects of falling birth rates accumulate gradually as fewer young people enter the population each year.
However, the pace varies:
Countries with rapidly declining fertility often see faster ageing.
Nations already experiencing long life expectancy may feel the impact sooner, as fewer births accelerate the shift in age structure.
In contrast, countries with high fertility may not see significant ageing until birth rates fall below replacement level.
Population ageing is difficult to reverse because once larger elderly cohorts exist, younger generations remain proportionally smaller for many years.
If birth rates rise, effects appear only in the long term:
A temporary baby boom may slow ageing but rarely restores a youthful age structure.
Sustained high fertility over decades is required to meaningfully rebalance age distribution.
Migration of young adults can influence short-term dynamics, but this relates to another subtopic.
Differences in life expectancy gains often reflect variations in economic development, health infrastructure, and disease burdens.
Key influences include:
Quality and accessibility of medical care
Prevalence of infectious vs. chronic diseases
Nutritional standards and environmental safety
Government investment in public health systems
Countries facing conflict or resource scarcity may have slower improvements even when birth rates decline.
When more children survive infancy and early childhood, the size of each cohort remains larger as it moves through the life course.
Over time:
More individuals reach middle and older ages.
Larger cohorts progress into older adulthood simultaneously, increasing the proportion of elderly people.
This process contributes to ageing even if fertility later declines.
Urban regions often have lower birth rates due to housing costs, lifestyle factors, and access to education and employment for women.
Additionally:
Urban populations benefit from better health care and living conditions, contributing to longer life expectancy.
Younger adults may migrate out of cities for affordability reasons, leaving a higher concentration of older residents behind.
These combined forces heighten ageing patterns within cities compared with rural areas.
