
AP Syllabus focus: ‘Changes in factors such as consumer income cause shifts in the demand curve, altering overall market demand.’
Understanding what shifts demand (not just changes quantity demanded) is essential for predicting how markets respond to changing economic conditions. These determinants explain why the entire demand curve moves, changing equilibrium outcomes.
Determinants of Demand: What Shifts the Demand Curve?
Determinants of demand: Non-price factors that change consumers’ willingness and ability to buy, causing the demand curve to shift (a change in demand), not a movement along the curve.
A change in the price of the good itself changes quantity demanded (movement along the same curve). A change in any determinant below changes demand (the whole curve shifts).
Direction of shifts
Increase in demand: demand curve shifts right (more demanded at every price)
Decrease in demand: demand curve shifts left (less demanded at every price)
Key Determinants (AP-level)
1) Consumer income (ability to buy)
Income is central to the syllabus focus: when consumer income changes, overall market demand can change at all prices.
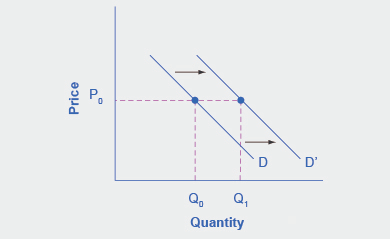
This figure illustrates an increase in demand as a rightward shift of the demand curve (from an initial curve to a new curve), meaning buyers want more of the good at every price. The key AP takeaway is that the curve shifts because a non-price determinant (here, income) changed—this is distinct from moving along a single demand curve when the good’s own price changes. Source
If income rises:
Demand for most goods rises (right shift) because households can afford more.
If income falls:
Demand often falls (left shift), reducing overall spending on many items.
In macro contexts, changes in income frequently come from employment conditions, wage growth, or the business cycle, but the demand effect is always shown as a shift, not a movement along the curve.
2) Prices of related goods
Demand for a good depends on the prices of substitutes and complements.
Substitutes (consumed instead of each other): if the price of a substitute rises, demand for this good rises (right shift).
Complements (consumed together): if the price of a complement rises, demand for this good falls (left shift).
These effects occur because consumers re-optimise their purchases at every possible price of the original good.
3) Tastes and preferences
Changes in preferences can shift demand even if prices and income stay constant.
Demand shifts right when a good becomes more desirable (fashion, perceived quality, health trends).
Demand shifts left when it becomes less desirable (negative publicity, changing social norms).
This determinant is often treated as an “other factors constant” breaker: it explains demand shifts not accounted for by measurable price or income changes.
4) Expectations (about future prices, income, or conditions)
If consumers expect conditions to change, they may adjust purchases today.
Expected higher future prices can increase current demand (right shift) as consumers buy now.
Expected lower future income can decrease current demand (left shift) as households postpone purchases.
In graphs, expectations are not drawn separately; they are captured by a shift of the current demand curve.
5) Number of buyers (market size)
Market demand aggregates many individual demands, so changes in the number of consumers shift demand.
Population growth, immigration, or a growing customer base shifts demand right.
Population decline or fewer participants shifts demand left.
This is especially important for interpreting demand in regional markets or over time as demographics change.
How to Show Determinants on a Demand Graph
Use a standard price–quantity graph:
Label original curve as D₁.
After a determinant changes, draw D₂ shifted left or right.
Keep the axes and scale consistent to make the shift visually meaningful.
Common AP mistake to avoid:
Do not draw a shift when only the good’s own price changes; that is a movement along D₁.
“Overall Market Demand” in One Sentence
When any determinant changes—especially consumer income—the market buys a different quantity at every price, so the entire demand curve shifts, changing equilibrium price and quantity.
Practice Questions
(2 marks) State two determinants that would shift the demand curve for a good and indicate the direction of the shift for each.
1 mark: Correct determinant identified (e.g. income, tastes, expectations, prices of related goods, number of buyers).
1 mark: Correct direction stated (left or right) consistent with the change described.
(6 marks) Explain how a fall in consumer income affects the demand curve for a good, and distinguish this from the effect of a fall in the good’s own price. Use correct diagrammatic language (shift vs movement).
1 mark: States that a fall in income is a determinant that changes demand.
1 mark: Identifies a leftward shift of the demand curve (decrease in demand).
1 mark: Explains “less demanded at every price” (market demand falls).
1 mark: States that a fall in the good’s own price causes a movement along the existing demand curve.
1 mark: Correctly links movement to change in quantity demanded (not demand).
1 mark: Uses accurate terminology throughout (e.g. “shift”, “movement along”, “quantity demanded”).
FAQ
Demand responds mainly to real income (purchasing power).
If nominal income rises but prices rise faster, real income falls, which can reduce demand for many goods even though pay cheques are larger.
This can happen for inferior goods, where higher income leads consumers to switch to higher-quality alternatives.
The demand curve for an inferior good can shift left when income rises, depending on consumer preferences and available substitutes.
If consumers expect interest rates to rise, borrowing may become more expensive later, so current demand for cars or appliances may increase.
If they expect rates to fall, they may delay purchases, decreasing current demand.
Preferences can shift due to advertising, social media, new information, or cultural change.
Economically, these are treated as exogenous shocks that shift demand, even when price and income are unchanged.
Age structure and household composition can change what is demanded, not only how much.
Ageing populations may raise demand for healthcare-related goods
More single-person households may change demand for housing types and services
