
AP Syllabus focus: ‘The law of supply states there is a positive relationship between price and quantity supplied, resulting in an upward-sloping curve.’
The law of supply explains how producers respond to price changes in a market economy. It links incentives, production decisions, and the graphical supply curve used throughout macroeconomics to describe economy-wide output responses.
The Law of Supply
Law of supply: Ceteris paribus, as the price of a good or service rises, the quantity supplied rises; as price falls, quantity supplied falls.
This positive relationship is what generates an upward-sloping supply curve: higher prices are associated with larger quantities producers are willing and able to sell.
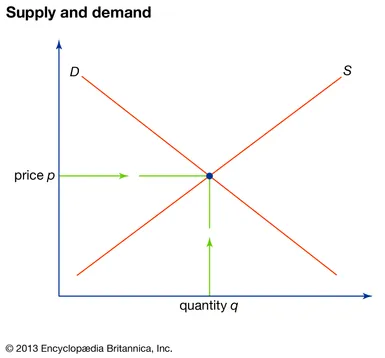
Supply is drawn upward sloping: as price on the vertical axis rises, producers move to a point on the supply curve with a larger quantity supplied on the horizontal axis. The diagram also situates supply in the broader market context by showing how it can intersect demand to determine an equilibrium price and quantity. Source
Quantity supplied (what changes when price changes)
Quantity supplied: The amount of a good or service that producers are willing and able to sell at a particular price over a given time period.
The key implication is mechanical for graphs and reasoning: a change in the good’s own price leads to a movement along a given supply curve, reflecting a different quantity supplied at that new price.

The figure illustrates a change in quantity supplied as movement along a fixed supply curve . When price changes, you stay on the same curve and trace to the new point to read the corresponding quantity supplied; the curve itself does not shift. Source
Why supply is upward-sloping
Incentives and profitability
Higher prices increase the potential revenue per unit, making it more attractive for firms to:
Produce additional units
Bring existing inventory to market
Allocate more capacity toward that product (when feasible)
Even if a firm’s costs do not change, a higher price can turn previously unprofitable units into profitable ones, increasing quantity supplied.
Rising marginal cost in production
In many real production settings, producing more output eventually raises the marginal cost of each additional unit because:
Some inputs are less efficient when production is pushed beyond normal levels
Overtime pay, faster machine wear, and coordination problems raise per-unit costs
Physical or organisational constraints create diminishing marginal returns in the short run
As marginal costs rise, firms typically require a higher price to justify supplying additional units, which supports an upward-sloping supply curve.
Individual supply and market supply
A supply curve can describe one producer or an entire market.
Supply curve: A graph showing the relationship between price and quantity supplied, holding other factors constant.
Market supply reflects the combined behaviour of many firms:
At any given price, some firms can profitably supply larger quantities than others
Higher prices tend to bring more total output to market because more firms expand production and more units become worthwhile to produce
This is why the market supply curve is also upward sloping: it summarises many producers’ price-responsive decisions.
Reading and using the supply curve correctly
What “ceteris paribus” protects
The law of supply is a conditional statement: it isolates the effect of the good’s own price on quantity supplied. It assumes other influences on producers are unchanged so you can attribute changes in quantity supplied to the price change itself.
Slope and interpretation (without shifting the curve)
When price changes:
You do not redraw the supply curve
You identify the new price on the vertical axis
You read the corresponding quantity supplied on the horizontal axis
You describe a movement along the curve from one point to another
What the upward slope means in words
An upward-sloping supply curve means producers generally require higher prices to supply additional units, reflecting incentives and increasing marginal costs. This relationship underpins many macroeconomic arguments about how production responds when prices in an economy rise or fall.
Common AP pitfalls to avoid
Confusing quantity supplied (a point on a curve) with supply (the entire curve)
Treating “law of supply” as a claim that producers always supply more regardless of constraints; it is a tendency under ceteris paribus
Forgetting that the law describes the relationship between price and quantity supplied, not between quantity supplied and unrelated factors
Practice Questions
(3 marks) State the law of supply and explain why it implies an upward-sloping supply curve.
1 mark: Correct statement of the law of supply (price up, quantity supplied up; ceteris paribus).
1 mark: Links the law to an upward-sloping supply curve (positive relationship on a graph).
1 mark: Gives a valid reason (e.g., higher prices increase profitability or firms need higher prices to cover rising marginal costs).
(6 marks) A firm selling bottled water faces a rise in the market price of bottled water. Explain, using economic reasoning, how and why the firm’s quantity supplied changes.
1 mark: Identifies this as a change in quantity supplied due to a price change (not a shift).
1 mark: States quantity supplied increases when price increases (ceteris paribus).
2 marks: Explains incentive/profit mechanism (higher revenue per unit makes additional output worthwhile).
2 marks: Explains rising marginal cost/diminishing returns as output expands, requiring higher price to supply extra units.
FAQ
Yes. Rare cases include perishable goods dumped due to spoilage constraints, quotas/capacity ceilings, and unusual labour supply responses (backward-bending supply). These are exceptions to the typical ceteris paribus pattern.
Yes. Perfectly elastic supply (horizontal) means producers can supply any quantity at a fixed price. Perfectly inelastic supply (vertical) means quantity cannot change with price, often due to a hard capacity limit or fixed stock.
In very short periods, firms may be unable to adjust output, so quantity supplied responds weakly to price. Over longer periods, firms can add shifts, hire labour, and expand capacity, making quantity supplied more responsive.
Adjustment costs and frictions can delay responses, such as production lead times, contracts, regulatory approvals, or the need to train workers. Firms may also wait to see if the price change is temporary before expanding output.
With inventories, firms can increase quantity supplied quickly by selling stock when price rises, even before production increases. Inventory decisions also reflect expectations: if firms expect higher future prices, they may withhold stock today despite a current price increase.
