
AP Syllabus focus: ‘Supply is elastic when elasticity is greater than 1, inelastic when it is less than 1, and unit elastic when it equals 1.’
Supply elasticity classifies how strongly producers adjust output when price changes. Understanding elastic, inelastic, and unit elastic supply helps you predict whether market adjustments happen mostly through quantity changes or price changes.
Core idea: classifying supply responsiveness
Price elasticity of supply compares the responsiveness of quantity supplied to a change in a good’s own price. The classification depends on whether the elasticity value is greater than, less than, or equal to 1.
Price elasticity of supply (PES): A measure of the percentage change in quantity supplied divided by the percentage change in price.
PES is typically positive because price and quantity supplied usually move in the same direction.
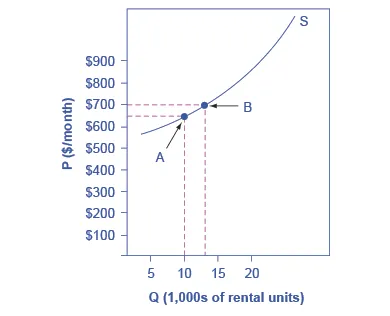
This graph shows a supply curve with two points (A and B) used to compute price elasticity of supply as PES=\frac{%\Delta Q_s}{%\Delta P}. By comparing the change in quantity supplied to the change in price between two points on the same supply curve, the figure reinforces that elasticity is calculated from percentage changes, not simply from the curve’s slope. Source
The size of PES (not the sign) determines whether supply is elastic, inelastic, or unit elastic.
Price\ Elasticity\ of\ Supply\ (PES) = \dfrac{%\Delta Q_s}{%\Delta P}
= percentage change in quantity supplied
= percentage change in price
Elastic, inelastic, and unit elastic supply
Elastic supply (PES > 1)
When supply is elastic, producers change output by a larger percentage than the price change.
Elastic supply: Supply is elastic when , meaning quantity supplied is relatively responsive to price changes.
Key interpretation:
A given percentage price increase leads to a more than proportionate percentage increase in .
Market adjustments to higher demand tend to show larger quantity increases and smaller price increases, all else equal, because firms can expand output relatively easily.
Inelastic supply (PES < 1)
When supply is inelastic, producers change output by a smaller percentage than the price change.
Inelastic supply: Supply is inelastic when , meaning quantity supplied is relatively unresponsive to price changes.
Key interpretation:
A given percentage price increase leads to a less than proportionate percentage increase in .
Market adjustments tend to show smaller quantity increases and larger price increases, all else equal, because output cannot expand much when price rises.
Unit elastic supply (PES = 1)
When supply is unit elastic, the percentage change in quantity supplied equals the percentage change in price.
Unit elastic supply: Supply is unit elastic when , meaning quantity supplied changes by the same percentage as price.
Key interpretation:
Producers’ responsiveness is “proportionate”: a 10% price increase corresponds to a 10% increase in (in percentage terms).
Unit elastic supply is a useful benchmark separating “more responsive than price” from “less responsive than price.”
Linking elasticity to the appearance of the supply curve
Elasticity is about percentage responsiveness, not “steepness” alone, but the shape of the supply curve still provides visual intuition:
Relatively flat supply curve (gentle slope): tends to indicate more elastic supply (larger response for a given change).
Relatively steep supply curve: tends to indicate more inelastic supply (smaller response for a given change).
Two important extreme cases help anchor the concept:
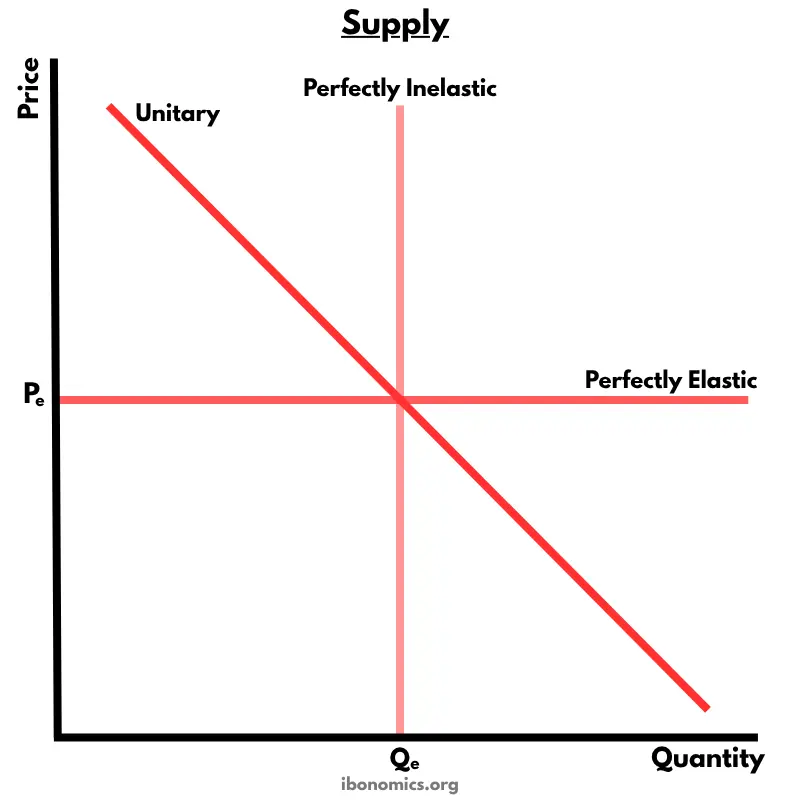
This diagram contrasts three benchmark supply curves: perfectly inelastic (vertical, ), perfectly elastic (horizontal, ), and unit elastic (upward sloping with ). Seeing these cases side-by-side helps you connect the elasticity value to the visual intuition of whether quantity can adjust at all versus adjusting dramatically. Source
Perfectly inelastic supply: quantity supplied is fixed at some level regardless of price (a vertical supply curve). PES is effectively 0.
Perfectly elastic supply: producers will supply any quantity at a particular price but none at prices below it (a horizontal supply curve). PES is effectively infinite.
These extremes are idealised, but they clarify what it means for quantity to be unable to adjust versus being able to adjust enormously.
What elasticity tells you in market adjustment language (without doing calculations)
Elasticity categories translate directly into “who adjusts more, price or quantity?” when market conditions push on producers:
If supply is elastic:
Producers can scale output up or down substantially.
Price changes needed to induce output changes are relatively small.
If supply is inelastic:
Output is relatively “stuck” in the short run, or difficult to change.
Larger price movements are needed to ration limited quantity or to encourage modest output expansion.
If supply is unit elastic:
Price and quantity adjust in roughly balanced percentage terms.
Because the AP classification hinges on whether PES is greater than, less than, or equal to 1, you should be able to:
Interpret any given PES value as elastic, inelastic, or unit elastic
Describe responsiveness in percentage terms (more than proportionate, less than proportionate, proportionate)
Connect the category to whether market adjustments are likely to be quantity-driven or price-driven
Practice Questions
Question 1 (2 marks) A good has a price elasticity of supply of .
(a) State whether supply is elastic, inelastic, or unit elastic. (1 mark)
(b) Describe what this implies about the responsiveness of quantity supplied to price changes. (1 mark)
(a) Inelastic (1)
(b) Quantity supplied changes by a smaller percentage than price / relatively unresponsive to price changes (1)
Question 2 (6 marks) Explain the difference between elastic and inelastic supply. Using percentage-change language, explain how producers’ output responses differ when price rises, and relate this to the general steepness/flatness of the supply curve.
Defines or correctly states elastic supply as (1)
Defines or correctly states inelastic supply as (1)
Explains elastic: greater than (1)
Explains inelastic: less than (1)
Links elastic supply to relatively flatter supply curve (1)
Links inelastic supply to relatively steeper supply curve (1)
FAQ
Yes. Even if the slope is constant, elasticity depends on percentages, which change with the starting price and quantity.
At higher prices and quantities, the same absolute change can be a smaller percentage change, altering PES.
In standard supply behaviour, PES is not negative because higher prices typically increase quantity supplied.
A negative value would imply quantity supplied falls as price rises, which is atypical and usually signals a misinterpretation of the scenario or measurement.
It means a tiny increase above the given market price would induce an extremely large percentage increase in quantity supplied.
Graphically, this corresponds to a horizontal supply curve at that price.
Because 1 separates cases where quantity responds more (elastic) versus less (inelastic) than price in percentage terms.
This threshold is also a convenient benchmark for predicting whether adjustment pressures show up mainly in quantities or mainly in prices.
When firms are near full capacity, additional output becomes harder to add quickly, making supply appear more inelastic over that range.
When there is spare capacity, output can expand more readily, making supply appear more elastic over that range.
