
AP Syllabus focus: ‘Price elasticity of supply equals the percentage change in quantity supplied divided by the percentage change in price.’
Price elasticity of supply (PES) quantifies how strongly producers change output when price changes. This page focuses on calculating PES correctly, using percentage changes and clear sign conventions, as expected in AP Microeconomics.
Core idea: responsiveness of quantity supplied to price
Price elasticity of supply (PES) compares two percentage changes: how much quantity supplied changes relative to how much price changes. In most AP contexts, PES is reported as a positive number because price and quantity supplied move in the same direction.
Price elasticity of supply (PES): The percentage change in quantity supplied divided by the percentage change in price, measuring sellers’ responsiveness to a price change.
PES is a unit-free measure (a ratio of percentages). That makes it useful for comparing responsiveness across different markets even when units differ (e.g., gallons versus haircuts).
The PES calculation
Basic formula (using percentage changes)
Price\ elasticity\ of\ supply\ (PES) = \dfrac{%\Delta Q_s}{%\Delta P}
= price elasticity of supply (unit-free)
= percentage change in quantity supplied
= percentage change in price
When you calculate PES from two points on a supply curve (two price–quantity combinations), you must compute both percentage changes consistently.
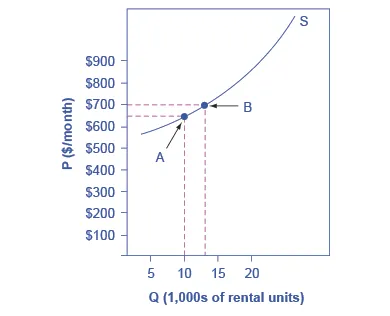
An upward-sloping supply curve with two labeled points (A and B) shows how a price change corresponds to a change in quantity supplied along the same curve. The dashed guide lines make the two coordinates explicit, which is helpful when computing and using the midpoint method. This supports the interpretation of PES as responsiveness along a supply curve rather than a shift of the curve. Source
A common AP expectation is to use the midpoint method to avoid getting different answers depending on the direction of the change.
Computing percentage changes (midpoint method)
= the variable whose percentage change is being found (e.g., or )
= initial value of
= new value of
Use the midpoint method separately for quantity supplied and price, then substitute into the PES formula. This approach is especially important when price changes are large, because “simple” percentage change based only on the initial value can distort elasticity comparisons.
Step-by-step process (no numbers required)
Calculating PES between two price–quantity points
Identify the two points: and .
Compute using the midpoint formula with and .
Compute using the midpoint formula with and .
Divide:
Report PES as a positive value in typical AP work (since supply is a direct relationship), unless a prompt explicitly asks you to keep the sign.
Common formatting expectations
Keep consistent rounding throughout a problem (e.g., round only at the end).
Label what you calculated: , , and PES.
State the interpretation in words when asked (e.g., “a 1% increase in price leads to a ___% increase in quantity supplied”).
Sign conventions and interpretation basics
Because a supply curve is upward sloping, and typically change in the same direction, so PES is usually positive. If you compute with raw differences, both numerator and denominator should have the same sign, producing a positive ratio.
A PES value answers this interpretive question:
How many percent does quantity supplied change for a 1% change in price?
Interpretation is about percentage responsiveness, not absolute units. For instance, a small absolute change in could still be a large percentage change if the starting quantity is small.
What you are (and are not) calculating
PES uses movements along supply, not shifts
PES is defined for responsiveness of quantity supplied to the good’s own price. In calculation problems, you are typically comparing two points along a given supply curve (or two observed equilibrium points where the change is attributed to price incentives for sellers).
PES is not the slope of the supply curve
Slope is in units like “dollars per unit.” PES is a ratio of percent changes, so it is unit-free. Even on a straight-line supply curve, PES can differ from point to point because the percentage base (the midpoint) changes.
Calculation pitfalls to avoid (high-frequency AP errors)
Mixing methods: using midpoint for but not for .
Forgetting that percentages require a base: using and directly instead of percent changes.
Rounding too early: changing intermediate values can noticeably change the final ratio.
Using the wrong quantity measure: elasticity uses quantity supplied, not quantity demanded.
Treating PES as inherently negative: in standard AP reporting, PES is generally presented as positive for supply.
Practice Questions
Question 1 (1–3 marks) State the formula for price elasticity of supply and define each component in the formula.
1 mark: Correct formula: PES=\dfrac{%\Delta Q_s}{%\Delta P}
1 mark: Correctly defines as percentage change in quantity supplied
1 mark: Correctly defines as percentage change in price
Question 2 (4–6 marks) The price of a good rises from to , and the quantity supplied rises from to . Explain how to calculate price elasticity of supply using the midpoint method, and explain why the midpoint method is used.
1 mark: Uses midpoint percentage change structure for quantity:
1 mark: Uses midpoint percentage change structure for price:
1 mark: States to divide to obtain elasticity: PES=\dfrac{%\Delta Q_s}{%\Delta P}
1 mark: Notes PES is typically reported as a positive value for supply (same-direction changes)
1 mark: Explains midpoint avoids different answers depending on whether the change is measured from or
1 mark: Explains midpoint is especially useful for larger changes because it uses an average base, improving comparability
FAQ
When the change from $P_1$ to $P_2$ (or $Q_{s1}$ to $Q_{s2}$) is large relative to the starting value, initial-value percentages become sensitive to direction.
Using the midpoint method reduces this asymmetry because the base is $(X_1+X_2)/2$ rather than $X_1$.
In most AP Micro contexts, PES is reported as positive because $P$ and $Q_s$ move together.
However, if a question explicitly instructs you to “show the sign” or you are analysing unusual data where $P$ and $Q_s$ move oppositely, a negative result could appear and should be discussed rather than automatically converted.
If $%\Delta P=0$, then $PES=\dfrac{%\Delta Q_s}{0}$ is undefined.
In practice, this means elasticity cannot be computed from those two observations because there is no price change to relate the quantity response to.
Because it is a ratio of two percentages, units cancel. This matters because:
You can compare responsiveness across markets without converting units.
You must use percentage changes (not raw $\Delta Q_s$ or $\Delta P$), otherwise units would affect the magnitude.
Yes, if you are instructed to evaluate elasticity at a particular price/quantity by selecting two nearby points on the curve or by using calculus in more advanced settings.
For AP-style work, it is typical to:
Choose two points (often provided or easily read),
Apply the midpoint method,
Interpret the resulting PES as an approximation around that region of the supply curve.
