
AP Syllabus focus: ‘Shifts in market demand or supply change equilibrium price and quantity in competitive markets.’
Changes in markets often come from “non-price” forces like income, input costs, or technology.
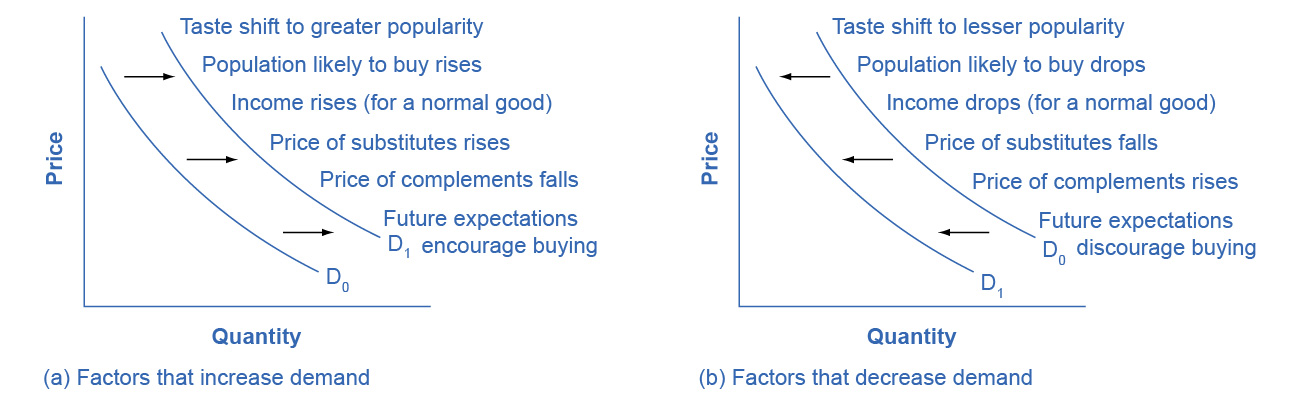
The diagram shows demand shifting right (increase) and left (decrease) and labels common non-price determinants that cause each shift (e.g., tastes, income for normal goods, related-good prices, expectations, and number of buyers). It reinforces that these forces change demand at every price, rather than producing a movement along a fixed demand curve. Source
This page explains how those forces shift curves and how to predict the resulting new equilibrium price and quantity.
Core idea: equilibrium changes only when curves shift
In a competitive market, the equilibrium is found where the demand curve and supply curve intersect. A shift changes the entire relationship between price and quantity, creating a new intersection.
Equilibrium: The price–quantity combination where quantity demanded equals quantity supplied, so the market-clearing price and quantity prevail.
A key AP skill is separating:
Movement along a curve: caused only by a change in that curve’s own price
Shift of a curve: caused by any determinant other than the good’s own price
How to analyse a shift (graph logic without calculations)
Step-by-step comparative statics
Use this consistent process:
Identify the shock (what changed in the real world).
Decide whether it affects demand, supply, or both.
Decide the direction of the shift (right/increase or left/decrease).
Hold the other curve constant (unless told it also shifts).
Locate the new intersection to determine the new equilibrium price and new equilibrium quantity.
Shift (of demand or supply): A change in the entire demand or supply schedule at every price, shown as a rightward (increase) or leftward (decrease) movement of the curve.
Demand shifts: what happens to and
When demand increases (curve shifts right), buyers want more at every price:
Equilibrium price rises
Equilibrium quantity rises
When demand decreases (curve shifts left):
Equilibrium price falls
Equilibrium quantity falls
The intuition: a rightward demand shift creates upward pressure on price; the higher price also induces a higher quantity supplied along the existing supply curve, producing a higher equilibrium quantity.
Supply shifts: what happens to and
When supply increases (curve shifts right), sellers offer more at every price:
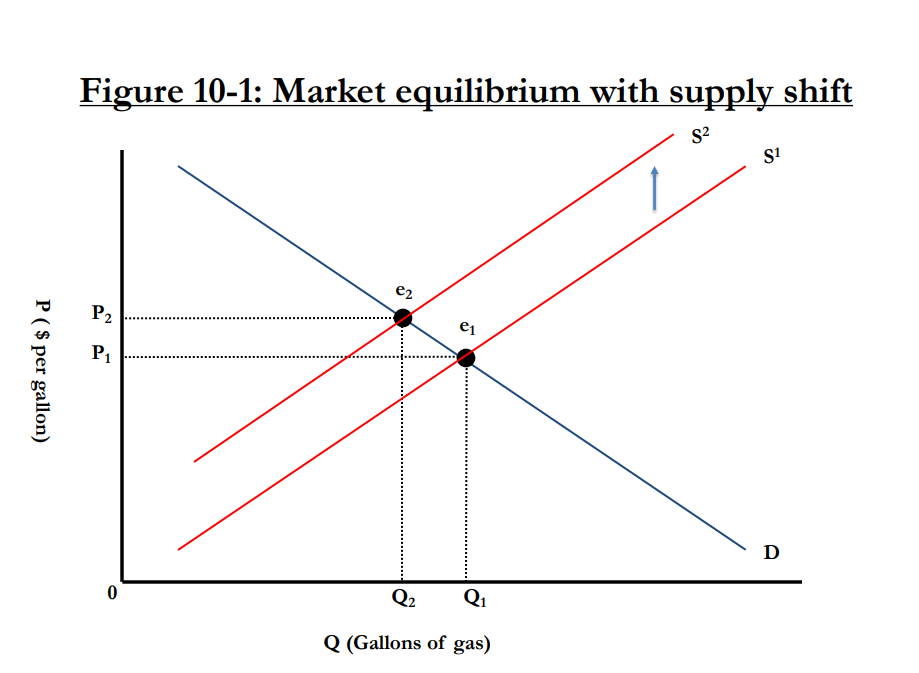
A rightward shift of the supply curve from to moves the market from the initial equilibrium to a new equilibrium . The figure makes the key prediction visually clear: equilibrium price falls while equilibrium quantity rises when supply increases and demand is unchanged. Source
Equilibrium price falls
Equilibrium quantity rises
When supply decreases (curve shifts left):
Equilibrium price rises
Equilibrium quantity falls
The intuition: a rightward supply shift creates downward pressure on price; the lower price also increases quantity demanded along the existing demand curve, producing a higher equilibrium quantity.
What is determined vs indeterminate with simultaneous shifts
Sometimes demand and supply shift at the same time. In that case:
The effect on price can be indeterminate (could rise, fall, or stay the same).
The effect on quantity can be indeterminate as well.
What becomes determinate depends on directions:
If demand increases and supply increases:
Quantity definitely increases
Price is indeterminate (demand pushes up, supply pushes down)
If demand decreases and supply decreases:
Quantity definitely decreases
Price is indeterminate
If demand increases and supply decreases:
Price definitely increases
Quantity is indeterminate
If demand decreases and supply increases:
Price definitely decreases
Quantity is indeterminate
The phrase “indeterminate” on AP-style questions means you cannot sign the change without knowing relative magnitudes of the shifts.
Magnitude matters (and what “relative size” means)
When both curves shift, the final outcome depends on which shift is larger. “Larger” means the curve moves farther at relevant prices, changing the intersection more. On a graph, this is shown by:
A bigger horizontal shift of demand or supply
A new intersection that ends up more influenced by one curve’s movement than the other
Even with a single shift, magnitude affects “how much” price and quantity change, but not the direction (for one-curve shifts, the direction is pinned down).
Anchoring equilibrium with the market-clearing condition
It can help to remember that equilibrium always satisfies the market-clearing requirement.
= Quantity demanded at price (units of the good)
= Quantity supplied at price (units of the good)
A shift changes either or , so the price that equates them changes, and the corresponding equilibrium quantity changes with it.
Common AP pitfalls to avoid
Do not label a shift in demand as “a change in quantity demanded”; that phrase is reserved for movements along demand due to price.
Do not treat a shift as a rotation; rotations are not the standard AP presentation for these questions.
When both curves shift, do not guess a price or quantity direction unless one is guaranteed by the shift directions. The market ends at the new intersection of the shifted curves.
Practice Questions
Question 1 (2 marks) A market starts in equilibrium. Consumers’ incomes rise and the good is normal. State the change in equilibrium price and equilibrium quantity.
Equilibrium price increases. (1)
Equilibrium quantity increases. (1)
Question 2 (6 marks) In a competitive market for coffee, improved technology lowers production costs at the same time that a health study reports benefits of moderate coffee consumption. Explain the effect on equilibrium price and quantity, and identify which outcome(s) are indeterminate without additional information.
Technology lowering costs increases supply (supply curve shifts right). (1)
Health study increases demand (demand curve shifts right). (1)
With both demand and supply increasing, equilibrium quantity increases (definite). (2)
Equilibrium price is indeterminate because demand puts upward pressure on price while supply puts downward pressure on price. (2)
FAQ
If only one curve shifts, the direction of changes in $P$ and $Q$ identifies it:
$P\uparrow, Q\uparrow$ suggests demand increase.
$P\downarrow, Q\uparrow$ suggests supply increase.
$P\uparrow, Q\downarrow$ suggests supply decrease.
$P\downarrow, Q\downarrow$ suggests demand decrease.
If $P$ and $Q$ move in the same direction, supply is less likely the sole cause; if they move in opposite directions, demand is less likely the sole cause.
It means how far the demand or supply curve moves, which determines where the new intersection lands. Evidence that one shift dominates can come from:
Size of the underlying shock (e.g., dramatic cost drop versus minor preference change)
Time horizon (some adjustments are gradual)
Market coverage (a nationwide change tends to be larger than a local one)
Yes, if both demand and supply shift and their effects on price offset exactly. The new intersection can occur at the original price with a different quantity. Without information about the sizes of shifts, you generally cannot assert that price is unchanged.
Use a disciplined sentence structure:
“Demand (or supply) shifts right/left because…”
“This creates upward/downward pressure on price.”
“The market moves to a new equilibrium with $P^$ ___ and $Q^$ ___.”
For simultaneous shifts, explicitly state what is definite and what is indeterminate.
Not the direction for a one-curve shift, but they affect the incidence between price and quantity adjustments. More elastic opposing curves tend to produce larger quantity changes and smaller price changes after a given shift, and vice versa.
