AP Syllabus focus: 'The temperature at which an ideal gas has zero pressure can be extrapolated from a pressure-temperature graph.'
A pressure-temperature graph lets you connect measurable gas behavior to a fundamental temperature scale. For an ideal gas, extending the graph backward reveals the temperature that corresponds to zero pressure.
Pressure-Temperature Graphs and Absolute Zero
For a fixed amount of gas in a constant-volume container, pressure changes in a simple way as temperature changes. If the gas gets hotter, its particles collide with the container walls more energetically, so the pressure increases. If the gas cools, those collisions become less forceful and less frequent in effect, so the pressure decreases.
A graph of pressure versus temperature is useful because it shows this trend visually. For an ideal gas, the graph is linear. That means the data points follow a straight-line pattern rather than a curve. This straight-line behavior allows scientists to extend the graph beyond the measured data and estimate where the pressure would become zero.
Absolute zero: The temperature at which an ideal gas would have zero pressure on an extrapolated pressure-temperature graph. It is 0 K, which is about -273 °C.
This idea is important because ordinary thermometers do not directly “see” absolute zero. Instead, the value is inferred from the way gas pressure changes with temperature. When pressure is plotted against temperature in degrees Celsius, the straight-line graph does not pass through zero at 0 °C. Instead, if extended backward, it crosses the temperature axis near -273 °C.
For an ideal gas at constant volume, pressure is directly proportional to absolute temperature.
= gas pressure
= constant for a fixed gas sample at constant volume
= absolute temperature in kelvins
This equation shows that if the temperature in kelvins is doubled, the pressure is doubled, provided the gas remains ideal and the volume does not change. It also shows why the Kelvin scale is so important: on a pressure-temperature graph using kelvins, the line would pass through the origin.
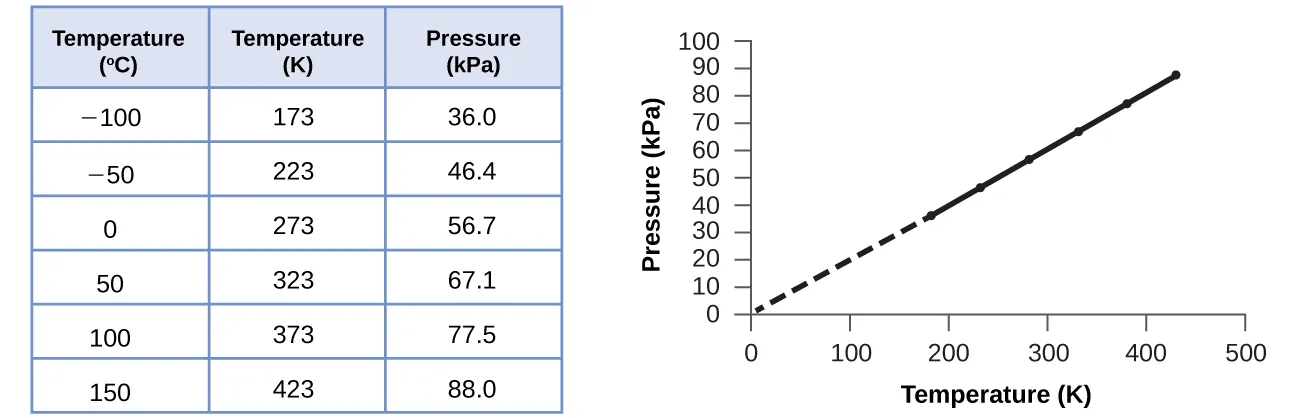
Pressure vs. temperature data for a fixed-volume gas with a linear best-fit trend and an extrapolation toward . The figure visually connects the proportionality (in kelvins) to the idea that extending the line predicts the temperature corresponding to zero pressure (absolute zero). Source
At , the ideal-gas pressure would also be zero.
Why Extrapolation Is Needed
In experiments, measurements are usually taken over a practical temperature range, not all the way down to the lowest possible temperatures. The graph is then extended beyond the measured region to estimate the temperature where the line reaches .
Extrapolation: Extending a pattern or graph beyond the measured data in order to estimate a value outside the observed range.
Extrapolation works here because the ideal-gas pressure-temperature relationship is linear. If the measured points form a straight line, that line can be continued to find the x-intercept, the place where the graph crosses the temperature axis. On a pressure-versus-temperature graph, the x-intercept corresponds to zero pressure. That intercept gives the estimate of absolute zero.
The graph should be interpreted carefully. If the horizontal axis is in kelvins, the x-intercept is 0 K. If the horizontal axis is in degrees Celsius, the x-intercept is about -273 °C. These are the same physical temperature written in two different temperature scales.
How to Read the Graph
To use a pressure-temperature graph correctly, focus on the straight-line trend rather than on a single point.
The vertical axis shows pressure.
The horizontal axis shows temperature.
The best-fit line represents the overall relationship in the data.
The point where that line reaches zero pressure gives the estimate of absolute zero.
Experimental points may not lie perfectly on the line because of measurement uncertainty.
A best-fit line is especially important because real data usually contain small scatter. The estimate of absolute zero should come from the line that best represents the full data set, not from guessing based on one pair of measurements.
What the Intercept Means Physically
The x-intercept is not just a graph feature. It represents a limiting temperature at which the pressure of an ideal gas would vanish. In the ideal-gas model, zero pressure means the gas particles would no longer produce pressure on the container walls in the usual way associated with thermal motion.
This does not mean a real laboratory sample can simply be cooled all the way to that point while staying an ideal gas. The key AP Physics 2 idea is the graphical inference: the pressure-temperature line can be extended to estimate the temperature associated with zero pressure.
Common Features of Pressure-Temperature Graphs
Different experiments may produce different slopes, but the intercept associated with absolute zero should be the same for ideal gases.
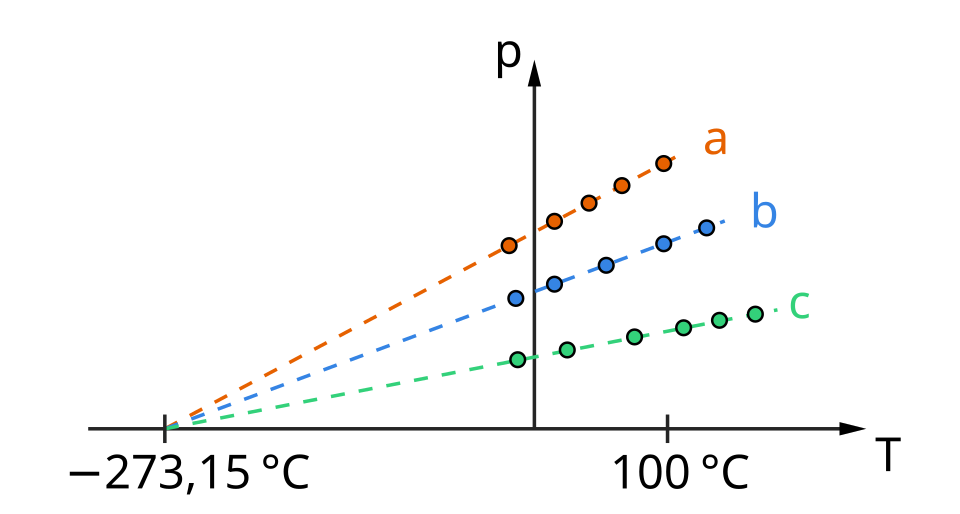
Pressure–temperature lines for different gas samples at the same volume, all extrapolating to a common x-intercept. The differing slopes represent different proportionality constants (set by the sample and conditions), while the shared intercept highlights that absolute zero is a universal limit in the ideal-gas model. Source
A steeper slope means pressure changes more rapidly with temperature.
A shallower slope means pressure changes less rapidly with temperature.
The slope can vary with the amount of gas or the container conditions.
The x-intercept is the crucial feature for estimating absolute zero.
If the graph is linear, extrapolation is justified within the ideal-gas model.
Common Mistakes to Avoid
Confusing the x-intercept with the y-intercept.
Forgetting that the graph must represent a constant-volume gas sample.
Assuming the intercept is 0 °C instead of about -273 °C when Celsius is used.
Reading the estimate from scattered points instead of from the best-fit line.
Treating extrapolated values as directly measured values rather than inferred ones.
Practice Questions
A pressure-versus-temperature graph for an ideal gas is plotted with temperature in degrees Celsius. The best-fit line crosses the temperature axis at -273 °C.
State the physical significance of this intercept.
1 mark: Identifies the intercept as an estimate of absolute zero.
1 mark: States that this corresponds to the temperature at which an ideal gas would have zero pressure.
A student measures the pressure of a fixed gas sample at several temperatures while keeping the volume constant. The student plots pressure against temperature in degrees Celsius and finds that the data lie close to a straight line. The best-fit line crosses the temperature axis near -272 °C.
Explain why this graph can be used to estimate absolute zero, and discuss why the result may not be exactly -273 °C.
1 mark: States that the gas sample is at constant volume.
1 mark: States that for an ideal gas, pressure is directly proportional to absolute temperature.
1 mark: Explains that a straight-line graph allows extrapolation beyond the measured data.
1 mark: Explains that the x-intercept occurs when , so it estimates absolute zero.
1 mark: Gives a valid reason for a small difference from -273 °C, such as measurement uncertainty, imperfect best-fit line, or non-ideal gas behavior.
FAQ
The slope depends on how much gas is present and the experimental setup, especially the container volume.
The intercept is tied to the temperature scale itself. For ideal-gas behavior, all gases should point to the same zero-pressure temperature, which is absolute zero.
More data points make the best-fit line more reliable.
With only a few points, random measurement errors can shift the line noticeably. A larger data set reduces the effect of outliers and gives a more trustworthy x-intercept.
A nonstraight graph suggests the ideal-gas model may not describe the data well over that range.
Possible causes include:
measurement problems
changing volume
gas leaks
the gas beginning to deviate from ideal behavior
In that case, the intercept is less reliable.
A graph can be extended mathematically even when measurements were not taken in that region.
This is useful when the pattern is strongly linear. However, the farther the line is extended beyond the data, the more carefully the estimate should be interpreted.
A straight line on paper may continue into a region where pressure would appear negative, but that region is not physically meaningful for an ordinary gas in this model.
The important point is the intercept itself: it marks the limiting temperature where the ideal-gas pressure would fall to zero.