
AP Syllabus focus: 'Summary statistics for one or more quantitative data sets can be used to justify claims about the data in context.'
Summary statistics turn large sets of numerical observations into usable evidence. In AP Statistics, they help you support claims about typical values, variability, and differences between quantitative distributions in context.
What This Subtopic Is About
A numerical summary is not useful by itself. Its value comes from how well it supports a claim about a quantitative data set. In AP Statistics, a good justification does more than list numbers. It explains what those numbers show in context.
When you justify a claim with summary statistics, you should connect:
the statistic
the comparison or description
the real-world context
For example, a response should not stop at “the median is larger.” It should explain what is larger, for which group, and why that matters for the variable being measured.
After introducing summary statistics, it is helpful to state exactly what they are.
Summary statistics: Numerical measures that describe important features of a quantitative data set, especially its center, spread, and position.
These statistics are evidence. Your job is to choose the right evidence and explain what it supports.
Choosing Statistics That Match the Claim
Different claims require different summary statistics. The strongest justifications use statistics that match the feature being discussed.
Claims About Center
A claim about center is a claim about a typical or usual value.
Useful summary statistics for center include:
mean
median
Use these when the claim is about which group tends to have higher values, lower values, or a greater typical amount.
A strong justification:
names the statistic used
compares the actual values
states the result in context
If unusually large or small values may affect the data strongly, the median often gives a better description of a typical value.
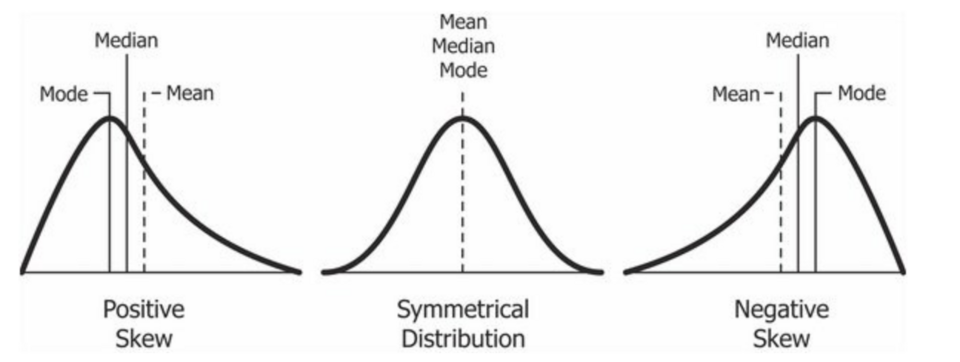
This figure compares distributions with different skewness and shows how the mean shifts relative to the median as the tail length changes. It makes the key idea concrete: the mean is pulled toward the tail, while the median is more resistant to extreme values, so mean–median ordering is informative about skew. Source
If the data are balanced enough that an average is meaningful, the mean can support a center-based claim well.
Claims About Spread
A claim about spread is a claim about variability or consistency.
Useful summary statistics for spread include:
interquartile range
standard deviation
sometimes range, if overall extent is the focus
These support claims such as:
one data set is more variable
one group is more consistent
values are more tightly clustered in one distribution than another
A smaller measure of spread indicates that values are packed more closely together. A larger measure of spread indicates more variability.
When discussing spread, do not switch to a statement about center. A group can have a higher typical value and still be more variable.
Claims About Position
Some claims focus on where values lie within a distribution.
Relevant summaries may include:
minimum
first quartile
median
third quartile
maximum
These can justify claims about:
the middle half of the data
the lower or upper part of a distribution
how high or low values extend
These statistics are especially useful when the claim refers to portions of the distribution rather than just one “typical” value.
Writing a Statistical Justification in Context
A complete AP-style justification usually follows a simple pattern:
identify the feature being claimed
choose the relevant summary statistic or statistics
report the values
make the comparison
interpret the comparison in context
The key phrase is in context. If the variable is test scores, waiting times, prices, or ages, say so. A justification is stronger when it names the actual variable instead of speaking only in abstract statistical language.
For instance, phrases like these are more effective than vague statements:
“The typical score is higher...”
“The waiting times are more variable...”
“The middle 50% of prices is lower...”
A justification should also be precise. Words such as higher, lower, greater spread, less variable, and more consistent are clearer than casual phrases like “better” or “more spread out” unless the context makes the meaning exact.
Comparing Two or More Data Sets
This subtopic often involves comparing multiple quantitative data sets. In those situations, summary statistics help you evaluate whether a claim is supported across groups.
When comparing data sets:
compare the same kind of statistic across groups
discuss center if the claim is about typical values
discuss spread if the claim is about consistency or variability
mention both center and spread when both are relevant to the claim
A useful habit is to pair statistics sensibly:
mean with standard deviation
median with interquartile range
This keeps your comparison internally consistent. If you compare medians for center, it often makes sense to use IQRs for spread. If you compare means, standard deviations often match that choice.
A strong comparison does not just say two numbers are different. It states what the difference suggests about the distributions.
What Makes a Claim Well Supported
A claim is well supported when the summary statistics directly match what the claim says.
For example, if the claim is about which group is more consistent, then a measure of spread must appear in the justification. If the claim is about which group tends to have larger values, then a measure of center must appear.
Good support usually includes:
the correct statistic for the claim
a direct numerical comparison
wording tied to the variable
no extra interpretation that the statistics do not support
This means you should avoid stretching the data beyond what the summaries show. Summary statistics can justify claims about the data, but only if the language stays aligned with the evidence.
Common Errors to Avoid
Common mistakes include:
listing statistics without explaining what they mean
using a measure of center to justify a claim about spread
using a measure of spread to justify a claim about typical value
changing from mean in one group to median in another
ignoring the context of the variable
using vague comparative words that do not clearly describe the data
Useful AP-Style Sentence Patterns
You can structure responses clearly with patterns like these:
“The typical value is higher for ... because the median/mean is greater.”
“... is more variable because its IQR/standard deviation is larger.”
“The middle 50% of ... falls between ... and ..., showing that ...”
These patterns help keep the claim, the statistic, and the context connected.
Practice Questions
A school compares the number of hours students sleep on school nights in two grades. Grade 9 has a median of 7.1 hours. Grade 10 has a median of 7.8 hours. Which grade has the higher typical amount of sleep? Justify your answer using summary statistics.
1 mark for identifying Grade 10 as having the higher typical amount of sleep.
1 mark for justifying with the median and stating that 7.8 hours is greater than 7.1 hours in context.
Two delivery services record the weights of packages they shipped last week.
Service A: mean weight 4.2 pounds, standard deviation 0.8 pounds, median 4.1 pounds, IQR 1.0 pound
Service B: mean weight 4.9 pounds, standard deviation 1.6 pounds, median 4.8 pounds, IQR 2.1 pounds
A manager claims, “Service B usually ships heavier packages, but its package weights are less consistent than Service A’s.” Use the summary statistics to determine whether the claim is supported. Explain your reasoning in context.
1 mark for stating that Service B has the higher center.
1 mark for supporting higher center with appropriate statistics, such as mean 4.9 versus 4.2 or median 4.8 versus 4.1.
1 mark for stating that Service B is less consistent or more variable.
1 mark for supporting greater variability with appropriate statistics, such as standard deviation 1.6 versus 0.8 or IQR 2.1 versus 1.0.
1 mark for a clear overall conclusion that both parts of the manager’s claim are supported in context.
FAQ
Use the level of precision given in the problem or in the data summary.
If the statistics are reported to one decimal place, keep your comparison at one decimal place unless there is a reason to be more precise.
Too much rounding can hide small but real differences. Too many decimal places can make a response look less clear.
A good rule is:
match the reported precision
keep units
do not round so heavily that two different values appear equal
Yes. The mean describes only one feature: center.
Two data sets with the same mean can still differ in:
median
IQR
standard deviation
minimum and maximum
quartile positions
That means they may have the same average value but very different variability or structure.
If a claim is about consistency, concentration, or the middle half of the data, the mean alone is not enough.
That is a sign that the distribution shapes may differ, or that unusually large or small values may be affecting one group.
In that situation:
do not ignore the conflict
state which statistics disagree
explain that different summaries are emphasizing different features
If the claim is about a “typical” value, the median may be more persuasive when extreme values are influencing the mean.
Your justification should stay honest about the disagreement rather than forcing one simple conclusion.
Yes. Summary statistics from a very small data set can change a lot if just one value changes.
With larger data sets, summaries are often more stable and may describe the overall pattern more reliably.
When sample sizes are very different:
note the summaries carefully
avoid overstating certainty
focus on what the reported statistics actually show
Even when sample size matters, your AP response should still center on the summary statistics provided.
Often, yes, but only for certain kinds of claims.
A five-number summary is useful for claims about:
median
spread of the middle 50%
overall extent
lower and upper portions of a distribution
It is less useful for claims that specifically require the mean or standard deviation.
So the answer depends on the claim. If the claim is about median or quartiles, a five-number summary may be enough. If the claim is about average value in the mean-based sense, it is not enough by itself.
