
AP Syllabus focus: 'The minimum, first quartile, median, third quartile, and maximum together make up the five-number summary.'
The five-number summary condenses an ordered quantitative data set into five values that locate the data from lowest to highest. It gives a quick picture of where the distribution begins, centers, and ends.
What the Five-Number Summary Is
The five-number summary is a standard numerical description of a quantitative data set.
Five-number summary: A set of five values consisting of the minimum, first quartile, median, third quartile, and maximum of an ordered quantitative data set.
These five values divide the distribution into four parts. Each part contains about one-quarter of the observations, although the widths of those parts do not have to be equal. Because of this, the summary shows both position and spread.
The components are:
Minimum: the smallest observed value
First quartile (): the value with about 25% of observations at or below it
Median: the middle value of the ordered data
Third quartile (): the value with about 75% of observations at or below it
Maximum: the largest observed value
A useful way to think about the summary is as a set of landmarks running from the lower end of the distribution to the upper end.
How to Find the Five Numbers
To produce a correct five-number summary, begin by arranging all observations in order from least to greatest. This step is essential because every part of the summary depends on the ordered positions of the data values.
Step 1: Identify the extremes
The first and last values in the ordered list are the minimum and maximum. These describe the lowest and highest observed values in the data set.
Step 2: Find the median
The median is the central observation in the ordered list.
If there is an odd number of observations, the median is the single middle value.
If there is an even number of observations, the median is the average of the two middle values.
The median separates the data into a lower portion and an upper portion.
Step 3: Find the quartiles
The quartiles come from the two halves of the ordered data.
is the median of the lower half.
is the median of the upper half.
In many AP Statistics settings, when there is an odd number of observations, the overall median is not included in either half when finding and . The main idea is that quartiles mark the one-quarter and three-quarter locations in the ordered distribution.
Because quartiles depend on position, not just on value, careful ordering matters. A small mistake in the ordering can change the summary.
What the Five-Number Summary Shows
The five-number summary is powerful because it compresses a large set of data into a short numerical description while preserving the basic layout of the distribution.
Center
The median gives the middle location of the distribution. It tells where the center lies in terms of ordered position.
Overall extent
The minimum and maximum show the full observed extent of the data. They tell where the distribution starts and ends among the recorded values.
Middle half of the data
The quartiles add structure to the description.
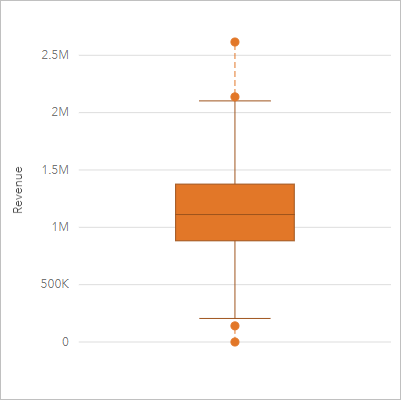
A labeled breakdown of box-plot components identifying the box (from to ), the median line, and whiskers that extend into the lower and upper tails. It helps you see that the interval from to contains the middle 50% of observations and visually compares how spread out each region of the distribution is. Source
The interval from to contains the middle 50% of the observations. This lets you see not only where the center is, but also where a large portion of the data is located.
Concentration within the distribution
The spacing between consecutive values in the summary also matters.
A short distance from the minimum to suggests the lower quarter of the data is packed into a small interval.
A larger distance from to the median suggests the next quarter is more spread out.
The same logic applies from the median to and from to the maximum.
So the five-number summary is more than a list of endpoints. It provides a compact description of how the data are arranged from low to high.
Interpreting in Context
A five-number summary should always be tied to the variable being measured and its units. The same set of numbers could mean very different things depending on whether the data represent minutes, dollars, inches, or points.
When interpreting a five-number summary, describe:
the smallest observed value
the lower-quarter location given by
the middle location given by the median
the upper-quarter location given by
the largest observed value
This is especially helpful when the raw data set is long. Instead of listing every observation, the summary communicates the basic structure efficiently.
The summary is also useful when two data sets measure the same variable in the same units. It provides a common format for comparing how low, middle, and high values are positioned.
Reporting the Summary Clearly
When writing a five-number summary, list the values in order:
minimum
median
maximum
Good statistical communication also includes:
consistent rounding when decimals appear
correct units
a clear statement of what the data represent
A complete report is not just the numbers themselves. It is the numbers connected to context.
Common Errors to Avoid
Students often lose accuracy because they rush the ordering or mix up positions in the data set.
Common errors include:
finding quartiles before ordering the data
confusing the median of the full set with the quartiles
using the wrong half of the data when locating or
leaving out units or context
assuming the five-number summary captures every detail of the distribution
Another important check is logical order: the minimum should come first, then , then the median, then , and finally the maximum. If the reported values do not follow that order, something has gone wrong.
Accuracy matters because the five-number summary is meant to give a concise and reliable description of an ordered quantitative distribution.
Practice Questions
The ordered data set below gives the number of books read by 7 students during a semester:
18, 21, 25, 27, 29, 31, 40
State the five-number summary.
1 mark for identifying minimum = 18, median = 27, and maximum = 40
1 mark for identifying and
A sample of 12 commute times, in minutes, is shown below:
12, 14, 15, 18, 19, 20, 24, 26, 29, 31, 35, 42
(a) Find the median.
(b) Find and .
(c) State the five-number summary.
(d) Use the five-number summary to describe the location of the middle 50% of the commute times and the overall observed span.
(a) 1 mark for median = 22
(b) 1 mark for
(b) 1 mark for
(c) 1 mark for five-number summary = 12, 16.5, 22, 30, 42
(d) 1 mark for stating that the middle 50% lies from 16.5 minutes to 30 minutes and the observed span runs from 12 minutes to 42 minutes
FAQ
Different calculators and software packages may use different quartile conventions, especially for small data sets.
The most common difference is how the middle value is handled when the number of observations is odd. Because of this, quartile values can differ slightly even when the same data are entered correctly.
On the AP Statistics exam, use the convention your course expects and stay consistent.
Yes. Repeated values are completely possible.
For example:
the minimum can equal $Q_1$
the median can equal $Q_1$ or $Q_3$
the maximum can equal $Q_3$
This usually happens when the data set is small or when many observations take the same value. Repetition does not make the summary incorrect.
That can happen when there is an even number of observations.
In that case, the median is the average of the two middle values, so it may fall between observed data points. This is still valid because the median is a positional measure, not a requirement that one original observation must be chosen.
The same idea can apply to quartiles in some data sets.
Missing values should not be treated as actual data.
Before ordering the data:
remove blanks or missing-value codes
confirm which observations are truly available
compute the summary only from recorded quantitative values
If missing entries are mistakenly included, every part of the five-number summary can be affected.
It can still be computed, but it is less stable.
With only a few observations, adding or removing one value can noticeably change the median or quartiles. That means the summary may shift a lot from one small sample to another.
So it is valid for small data sets, but it should be interpreted with extra caution.
