
AP Syllabus focus:
‘Overview of using numerical summaries (mean, standard deviation, range, IQR, etc.) to compare two or more independent samples.
- Emphasizing the role of summary statistics in analyzing and contrasting the central tendency and spread of distributions.
- Discussing how to effectively communicate findings from numerical comparisons to justify conclusions about data.
- Skill 2.D: Enhancing skills in employing numerical summaries for comparative analysis of quantitative data sets.’
Comparing distributions numerically provides a structured way to evaluate differences in center and variability across independent samples, strengthening interpretations and supporting justified, context-aware statistical claims.
Numerical Comparisons of Distributions
Numerical comparisons focus on using summary statistics—numeric measures describing aspects of a dataset—to contrast two or more independent quantitative distributions. These comparisons complement graphical methods by providing precise, quantitative evidence that supports claims about how distributions differ. In AP Statistics, students are expected to interpret and communicate these comparisons clearly, drawing on measures of center, spread, and relative variability to justify conclusions in context.

Side-by-side boxplots displaying distributions from five independent experiments, highlighting differences in medians and spreads that support numerical comparisons of center and variability. Source.
Measures of Center for Comparison
When comparing distributions, the mean and median serve as the primary indicators of central tendency. The mean is appropriate when data are reasonably symmetric and free from extreme values, while the median is a more resistant measure of center, meaning it is less affected by outliers or skewed distributions.
Resistant Statistic: A statistic that is not significantly influenced by extreme values in a dataset.
Using these measures allows students to determine which distribution tends to have higher or lower typical values, forming the foundation of comparative statements. A larger mean or median suggests that observations in one sample generally fall above those of another, but the validity of this comparison depends on the shape and variability of each distribution. Evaluating center alone is insufficient, making measures of variability essential components in comparative analysis.
Measures of Variability for Comparison
Variability indicates how spread out data values are within each distribution. Key measures include the range, interquartile range (IQR), and standard deviation, each highlighting a different aspect of spread. The range captures overall spread but is highly sensitive to extreme values. The IQR measures the spread of the central 50% of the data, making it resistant and useful when data contain outliers or skewness. Standard deviation reflects the average distance of data values from the mean and is especially informative when distributions are roughly symmetric.
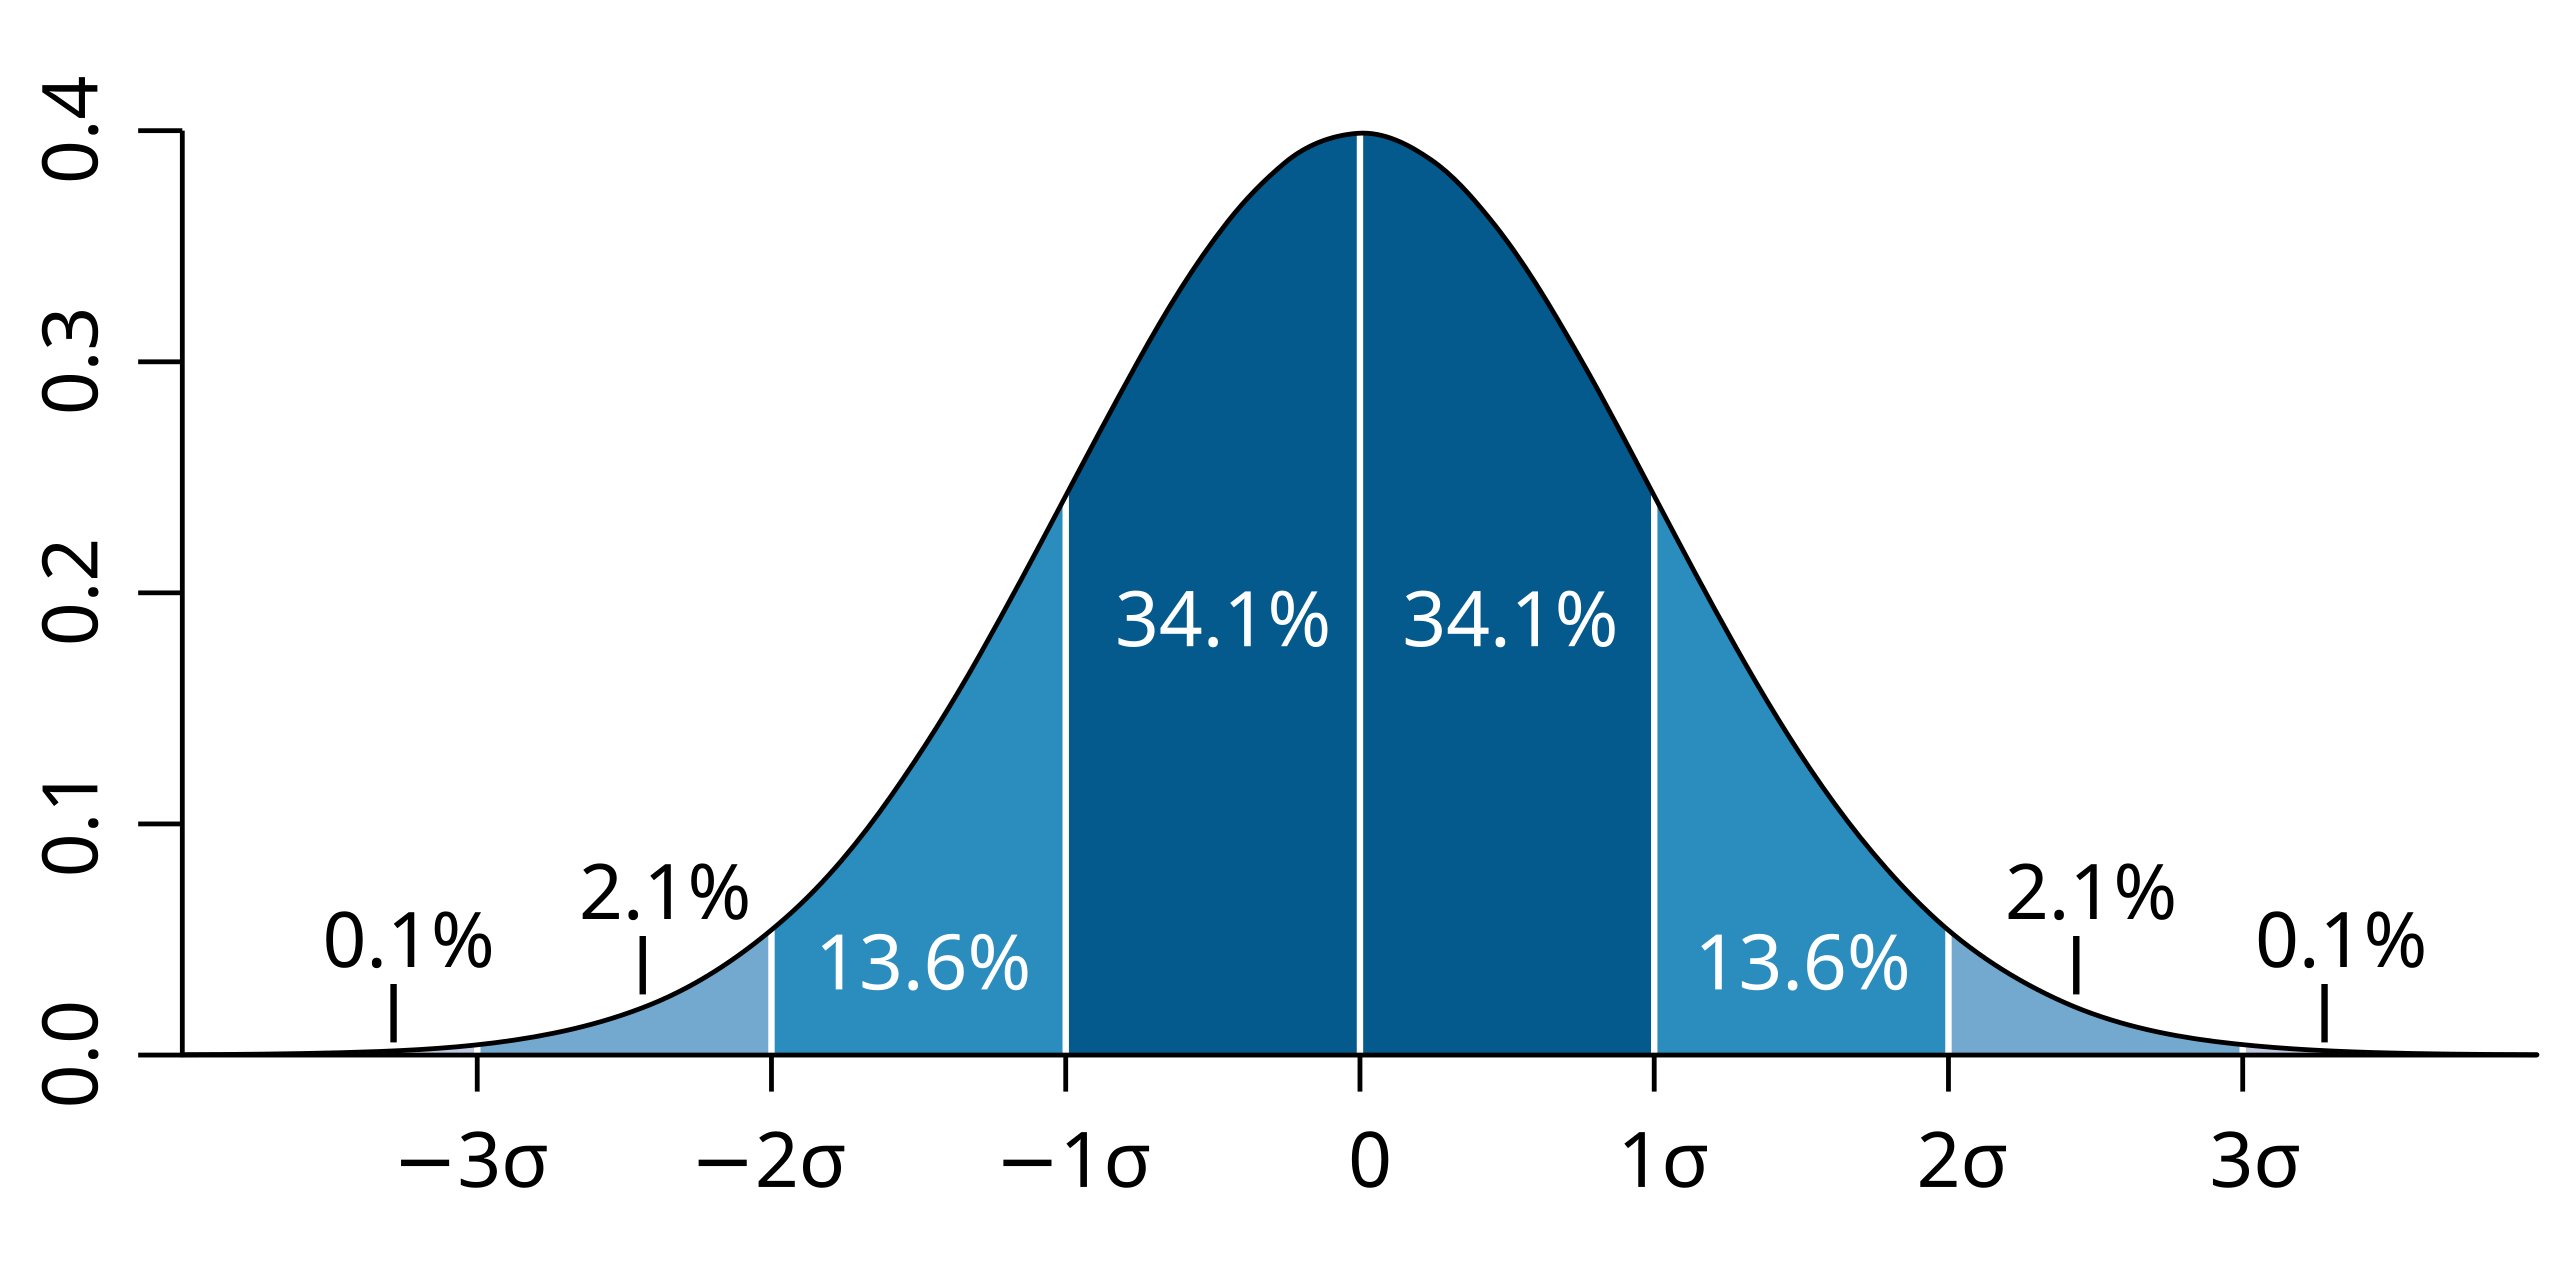
A normal distribution visualizing distances of one, two, and three standard deviations from the mean, reinforcing how standard deviation measures spread around the mean in symmetric distributions. Source.
Variability: The degree to which data values in a distribution differ from one another, often described through measures such as range, IQR, or standard deviation.
Numerical comparisons of variability help determine whether one sample exhibits greater consistency or wider dispersion than another. A larger standard deviation or IQR indicates a more variable distribution. These comparisons are crucial because two distributions may share similar centers but differ meaningfully in how spread out the data are.
Using Nonresistant and Resistant Statistics in Comparisons
Choosing appropriate statistics depends on distribution characteristics. Nonresistant statistics, such as the mean, range, and standard deviation, are influenced by outliers and skewness. Resistant statistics, including the median and IQR, provide more stable comparisons when data depart from symmetry.
Nonresistant Statistic: A statistic strongly affected by extreme values, potentially distorting conclusions about a dataset.
Effective numerical comparison requires evaluating which statistics best capture meaningful differences given the nature of the data. For example, if one distribution is heavily skewed, comparing medians and IQRs may offer more reliable insight than comparing means and standard deviations. Numerical comparisons should therefore be grounded in an understanding of each distribution’s shape and unusual features.
Communicating Numerical Comparisons
Clear communication is central to this subsubtopic. Students must be able to explain how differences in center and variability support claims about distributions in context. This involves articulating whether one sample tends to have higher typical values, exhibits greater spread, or displays more consistency. Contextual interpretations demonstrate understanding of what numeric differences imply about real-world phenomena.
When presenting comparisons, effective communication includes:
Identifying which summary statistics were used and why they are appropriate.
Describing differences in measures of center, such as noting which sample has a larger mean or median.
Discussing differences in spread, referencing standard deviation, IQR, or range as needed.
Embedding all comparisons within the context of the data to ensure meaningful interpretation.
Justifying conclusions by connecting numerical differences directly to the question or claim being addressed.
Integrating Center and Variability in Comparative Claims
Meaningful comparisons typically integrate both center and variability, as considering only one dimension can produce misleading or incomplete conclusions. For example, one distribution may have a higher mean but also substantially greater variability, suggesting less consistency despite a higher typical value. Conversely, a distribution with lower variability may indicate more predictable outcomes even if its center is lower.
Numerical comparisons allow students to articulate multi-dimensional insights, such as:
Whether differences in center are practically important given the amount of variability.
Whether distributions overlap substantially or remain distinct based on their spreads.
How differences in variability might influence decision-making or interpretation.
Understanding these relationships strengthens students’ ability to construct well-justified statistical arguments, aligning with Skill 2.D, which emphasizes selecting and interpreting appropriate numerical summaries to compare independent samples.
FAQ
When distributions overlap, numerical summaries provide clarity that visual inspection alone may not offer. Measures such as the difference in means or medians indicate whether one group tends to have higher typical values, even if the raw data intermingle.
Variability measures help assess whether the overlap is due to genuine similarity or simply wider spread in one group.
Bullet points can support interpretation:
• Large overlap but different centres suggests subtle but meaningful differences.
• Similar centres but different spreads indicate differing consistency rather than differing levels.
The range uses only the maximum and minimum values, making it highly sensitive to extreme observations. A single unusual value can inflate the range and give the appearance of greater variability than truly exists.
Because of this, the range is most informative when both distributions are free from outliers. Otherwise, more resistant measures such as the IQR provide a fairer comparison of spread.
Numerical summaries may not fully capture complex shapes or unusual features. For example, two distributions might share the same mean and standard deviation but differ substantially in symmetry or modality.
In such cases, numerical comparisons should be paired with graphical analysis.
Situations where numbers alone may fail:
• One distribution is bimodal while the other is unimodal.
• One distribution contains distinct clusters.
• Severe skewness obscures meaningful differences.
A large difference in IQR implies that the middle 50 per cent of one distribution is more widely spread than the other. This often reflects greater inconsistency or variability in the underlying process generating the data.
Possible interpretations include:
• One process is influenced by more fluctuating external factors.
• Participants or units contributing to one sample behave less uniformly.
• Operational or measurement procedures differ between groups.
Outliers can distort nonresistant measures such as the mean and standard deviation, potentially leading to misleading comparisons. A group with a few extreme values may appear to have a higher centre or greater variability than is typical for most observations.
To address this:
• Check resistant measures like the median and IQR.
• Review both sets of statistics for consistency.
• Consider whether outliers reflect genuine observations or possible data collection errors.
Practice Questions
Question 1 (1–3 marks)
Two independent samples were collected to compare weekly study hours between two groups of students.
• Group A: mean = 12.4 hours, standard deviation = 5.1 hours
• Group B: mean = 9.8 hours, standard deviation = 3.2 hours
Based on these numerical summaries, state which group tends to study more and which group shows greater variability. Justify your answer using the statistics provided.
Question 1 (1–3 marks)
• 1 mark: Correctly identifies that Group A tends to study more because it has the higher mean.
• 1 mark: Correctly identifies that Group A shows greater variability because it has the larger standard deviation.
• 1 mark: Justification refers directly to the provided numerical values.
Total: 3 marks
Question 2 (4–6 marks)
A researcher compared the daily number of website visits for two different advertising campaigns (Campaign X and Campaign Y) over a 30-day period. The numerical summaries are below:
• Campaign X: median = 420, IQR = 160
• Campaign Y: median = 380, IQR = 90
(a) Compare the centres of the two distributions.
(b) Compare the variability of the two distributions.
(c) Comment on which campaign appears more consistent and explain why.
(d) Explain why the median and IQR may be more appropriate measures than the mean and standard deviation in this comparison.
Question 2 (4–6 marks)
(a) 1 mark: States that Campaign X has a higher centre because its median (420) is greater than that of Campaign Y (380).
(b) 1 mark: States that Campaign X has greater variability because its IQR (160) is larger than Campaign Y’s IQR (90).
(c) 1 mark: Identifies Campaign Y as more consistent and explains that the smaller IQR indicates less variation in daily visits.
(d) 1–3 marks: Explains that the median and IQR are resistant to outliers or skewness, making them more appropriate if the distributions are not symmetric or contain extreme values.
Total: 6 marks
