
AP Syllabus focus:
‘- Introduction to the investigation of relationships between two variables, emphasizing the importance of considering variation in data.
Explaining that apparent patterns, trends, and associations in data may not always imply a causal relationship, as they could be due to randomness or other factors.
Skill 1.A: Developing the ability to identify research questions that explore possible relationships in two-variable data, considering the potential for randomness in observed patterns.
Essential Knowledge VAR-1.D.1: Emphasizing the critical examination of data for apparent patterns and associations, understanding that these observations may be random or have a significant underlying cause.’
Understanding relationships between two variables is a central goal of statistics. Careful examination helps distinguish meaningful patterns from random variation, supporting effective research questions and responsible interpretation of data.
Identifying Relationships in Data
Exploring relationships between two variables is one of the first steps in analyzing real-world data. Students must learn to observe patterns, question their reliability, and avoid assuming that visible trends necessarily reflect meaningful connections. This process begins with studying how variation influences apparent associations and progresses toward formulating appropriate research questions.
Investigating Two-Variable Relationships
When examining two-variable data, the goal is to determine whether an association exists.
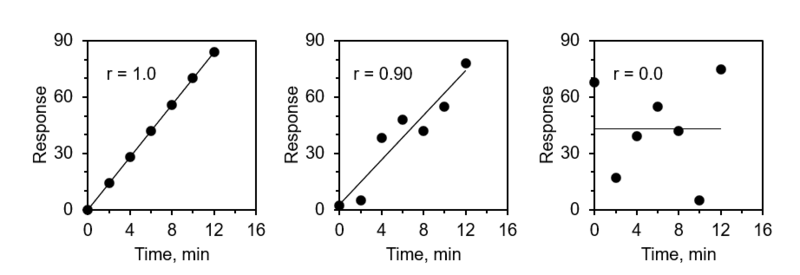
This figure shows three scatterplots of two quantitative variables with different degrees of positive association. In the left panel, points lie close to a straight upward-sloping line, indicating a strong association; in the middle panel, the pattern is weaker but still clearly positive. In the right panel, the points are scattered with no clear pattern, illustrating data that show little or no association and may simply reflect random variation. Source.
Association: A relationship in which specific values of one variable tend to occur with specific values of another variable more often than expected by chance.
Before claiming an association, the presence of variation must be considered. Variation refers to differences in data values across individuals. Because variation is inherent in data, random patterns can appear even when no true relationship exists. Students should critically evaluate whether visible trends signal something meaningful or arise from randomness.
Understanding Apparent Patterns
Patterns in two-variable data may seem convincing, but visual or numerical summaries can be misleading if randomness is not acknowledged. The syllabus emphasizes that apparent patterns, trends, and associations may not imply cause-and-effect relationships. Apparent structure can emerge from sampling variability, biased data collection, or unrelated external factors.
Recognizing this possibility helps prevent overinterpretation. A strong visual pattern does not guarantee that one variable influences the other. It simply indicates that further investigation is required.
Distinguishing Association from Causation
A key message of this subtopic is that association does not imply causation.
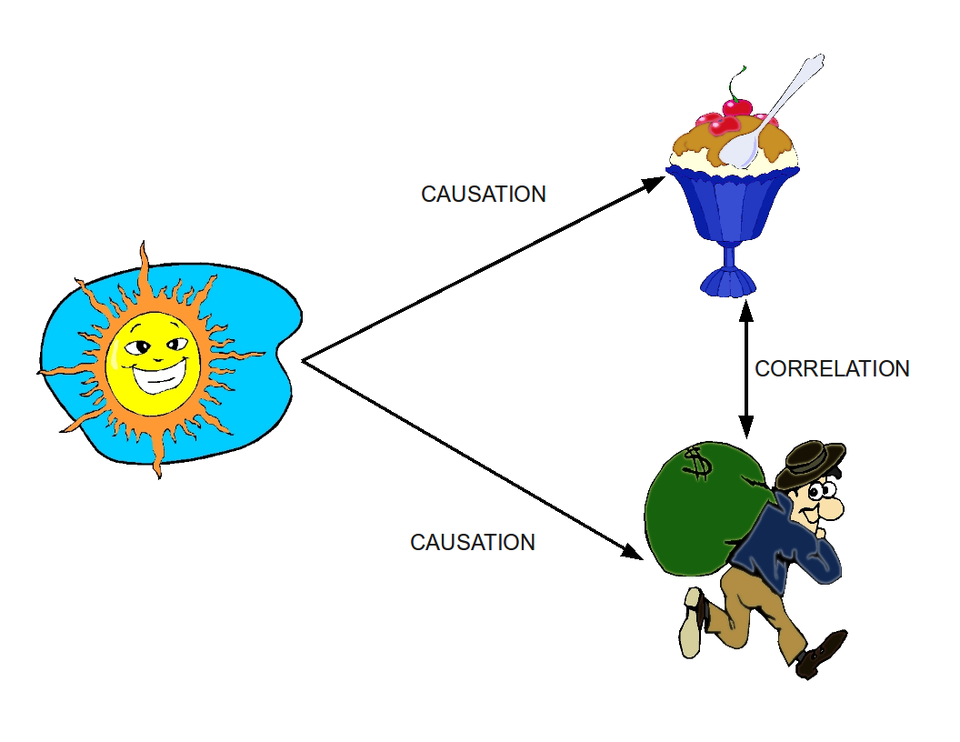
This diagram illustrates that higher ice cream consumption and higher crime rates can move together over time, yet neither causes the other. Instead, a lurking variable—temperature—affects both, creating a spurious association between ice cream sales and crime. The image reinforces the principle that even strong relationships in data must be interpreted cautiously, because association alone does not imply causation and may simply reflect the influence of an unmeasured variable. Source.
Even when a clear relationship is present, one variable may not cause changes in the other. Unseen variables, known as lurking variables, can create misleading associations. Students should examine relationships cautiously and avoid conclusions that extend beyond the evidence.
Lurking Variable: A variable not included in the study that influences both variables of interest, potentially creating a false or exaggerated association.
Considering lurking variables encourages a more accurate interpretation of observed data.
The Role of Randomness in Observed Relationships
Essential Knowledge VAR-1.D.1 highlights that students must examine whether an observed pattern is meaningful or simply due to randomness. Randomness can generate trends that appear systematic, especially in small samples. Critical thinking about variation helps prevent misinterpretation of such occurrences.
To assess whether randomness may be responsible for a pattern, students can:
Consider the sample size and how strongly it affects variability.
Evaluate the spread and consistency of data points.
Compare the observed relationship to what might occur by chance.
Ask whether external factors could generate the pattern without a true relationship.
A careful approach strengthens the ability to identify meaningful findings in two-variable data.
Developing Research Questions (Skill 1.A)
Skill 1.A focuses on creating research questions that explore possible relationships between two variables. Strong questions guide the analysis and prevent unsupported conclusions. Students should ensure that each research question clearly articulates the variables involved and the relationship being explored.
Effective research questions about two-variable data often:
Identify both variables explicitly.
Consider whether the question addresses association, comparison, or prediction.
Recognize that any relationship observed may be influenced by randomness.
Avoid implying causality without experiential justification.
Examples of wording for strong research questions include phrases such as “Is there an association between…,” “How does the value of one variable relate to…,” or “Do individuals in different categories differ in….”
Examining Data for Patterns and Variation
Exploration of two-variable data begins with observing variation. Students should identify meaningful patterns while acknowledging uncertainty. The process often includes:
Identifying clusters, gaps, or trends in the data.
Noting unusual points that may influence interpretation.
Considering the magnitude of variation within each variable.
Evaluating whether the relationship appears consistent or irregular.
These observations help determine whether further investigation, modeling, or data collection is appropriate. Recognizing the impact of randomness ensures that conclusions remain grounded in evidence.
Critical Examination of Data (UNC-1.P.1 Guidance Context)
Although this subsubtopic does not require graphical construction, it lays the foundation for the careful evaluation necessary when interpreting any representation of two-variable data. Students are expected to integrate critical reasoning with statistical tools. The ability to question what is seen—and whether it reflects a genuine relationship—is essential before moving into more advanced analyses involving categorical or quantitative variables.
The emphasis on critical examination prepares students for deeper study of scatterplots, two-way tables, and regression models in later sections. Through mindful scrutiny of variation and randomness, students build the reasoning skills needed to navigate increasingly complex statistical relationships.
FAQ
Small samples tend to show much greater variability, which can create patterns that look meaningful even when no true association exists.
Because fewer observations are available, random fluctuations exert a stronger influence on the overall pattern. A scatterplot or two-variable summary based on a small group can therefore exaggerate trends, making weak or nonexistent relationships appear stronger.
Analysts should:
• Treat patterns from small samples cautiously.
• Consider whether the same trend would plausibly appear in a larger group.
• Avoid drawing conclusions until more data are gathered.
Certain visual cues suggest the possibility of randomness rather than meaningful structure.
Common indicators include:
• Widely scattered points with no consistent direction.
• A pattern that changes dramatically when a few observations are removed.
• Clusters with no logical reason for their grouping.
• Sudden gaps in the data that do not reflect realistic circumstances.
These features should prompt caution and encourage closer examination of variation.
Researchers can take several steps to limit false conclusions.
• Increase sample size to reduce the influence of extreme or unusual observations.
• Use consistent and unbiased data collection procedures.
• Compare findings with results from similar groups or previous studies.
• Consider whether any external factors could have produced the pattern accidentally.
These strategies help ensure any observed relationship is more likely to reflect a genuine association.
Context helps determine whether a pattern is plausible or potentially random or misleading.
A relationship that makes sense within the setting of the data—such as physical limits, social factors, or logical connections—has more credibility than one with no reasonable explanation.
Without context, it becomes difficult to judge whether the association reflects a real phenomenon, the influence of an external variable, or random variation in the data.
Identifying possible lurking variables helps avoid placing undue weight on patterns that may not represent a true relationship between the variables measured.
A lurking variable can influence both variables of interest, making an association appear stronger or weaker than it truly is. Recognising this possibility encourages more cautious interpretation, better research questions, and more thoughtful decisions about whether further data or experimental controls are needed.
Awareness of these hidden influences strengthens the quality of statistical reasoning.
Practice Questions
Question 1 (1–3 marks)
A researcher observes that students who spend more hours studying per week tend to report higher levels of stress. Explain why this observed pattern does not necessarily mean that studying more causes higher stress levels.
Question 1 (1–3 marks)
• 1 mark: States that association does not imply causation.
• 1 mark: Mentions the possibility of a lurking variable or external factor influencing both studying time and stress.
• 1 mark: Explains that the pattern could arise from randomness or natural variation in the data.
Maximum: 3 marks.
Question 2 (4–6 marks)
A school collects data on two variables for a group of pupils: whether each pupil participates in after-school clubs (Yes or No) and whether they report feeling a strong sense of belonging at school (High or Low).
A preliminary review suggests that pupils who participate in clubs appear more likely to report high belonging.
(a) State one reason why this apparent association may not reflect a meaningful underlying relationship.
(b) Describe how variation in the data might lead to a pattern that looks convincing but could still be due to randomness.
(c) Suggest one research question that appropriately investigates the possible relationship between club participation and sense of belonging.
Question 2 (4–6 marks)
(a) (1–2 marks)
• 1 mark: Notes that the observed association may be due to a lurking variable (for example, confidence, social support, or school engagement).
• 1 mark: States that the apparent pattern does not necessarily imply a cause-and-effect relationship.
(b) (1–2 marks)
• 1 mark: Refers to variation in the sample and how small or unrepresentative samples can produce misleading patterns.
• 1 mark: Explains that random fluctuation could create an apparent association even when no true relationship exists.
(c) (1–2 marks)
• 1 mark: Provides a clear research question identifying the two variables (e.g., “Is there an association between participation in after-school clubs and pupils’ sense of belonging?”).
• 1 mark: Demonstrates appropriate wording that explores association without implying causation.
Maximum: 6 marks.
