
AP Syllabus focus:
‘Discussing the use of percentiles and z-scores for comparing relative positions of data points within a single dataset or between multiple datasets.
- Skill 2.D: Mastering the comparison of relative positions in datasets using measures of relative position, understanding their applications and implications in data analysis.’
Comparing relative position allows statisticians to understand how individual data points stand within a distribution, supporting meaningful comparisons both within a dataset and across different datasets.
Understanding Relative Position in Context
Relative position describes how a particular value compares to the rest of the data. It focuses not on the raw value itself but on its standing within the distribution. This perspective is essential in statistical reasoning because data values gain meaning only when interpreted relative to the wider context of the dataset. The AP syllabus emphasizes that measures such as percentiles and z-scores help communicate a data point’s standing clearly and consistently.
Percentiles as a Measure of Position
Percentiles indicate the percentage of observations in a dataset that fall at or below a certain value. When first introducing the term percentile, it is important to recognize how widely used it is across fields such as education, health, and economics.
Percentile: A value below which a specified percent of observations in a distribution fall.
Percentiles allow for intuitive comparisons because they frame a data point relative to the entire data distribution rather than its absolute magnitude. For example, expressing a value as being at the 72nd percentile immediately conveys that it is higher than 72% of all observations. Between any two definition or equation blocks, a meaningful sentence is required, reinforcing how percentiles enable consistent interpretation across contexts.
Percentiles are particularly useful when comparing distributions measured on different scales. Because percentiles express relative standing using percentages, they remain unaffected by differences in units, measurement conventions, or data ranges.
Percentiles indicate the percentage of observations in a dataset that fall at or below a certain value.
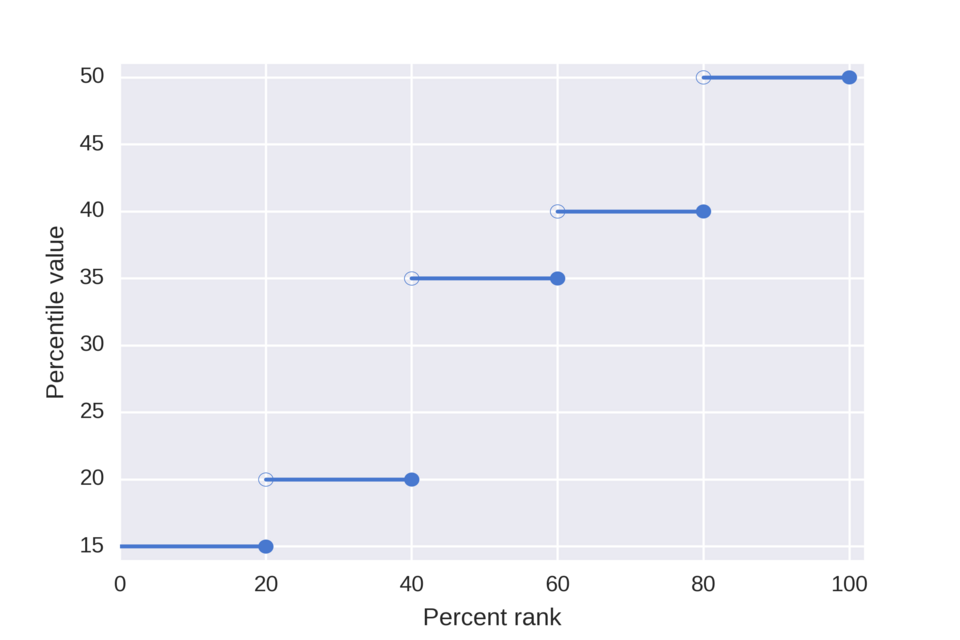
This graph illustrates one definition of a percentile, mapping percent ranks to specific data values. The plotted points show how ordered observations correspond to percentile positions. The image includes a formal definition beyond AP scope, but the underlying concept aligns with the syllabus focus on percentiles as measures of relative position. Source.
Z-Scores as a Standardized Measure of Position
While percentiles provide a rank-based comparison, z-scores offer a numerical measure in terms of standard deviations from the mean. A z-score incorporates both the center and variability of a distribution, giving it a powerful role in statistical comparison.
Z-score: A standardized value indicating how many standard deviations a data point lies above or below the mean.
Z-scores allow analysts to compare values from different datasets by placing them on the same standardized scale. This is especially important when distributions differ in center, spread, or measurement units. Because z-scores are standardized, they enable direct comparisons that would be impossible using raw data values alone.
EQUATION
= Data value
= Mean of the distribution
= Standard deviation of the distribution
Using z-scores helps determine whether a value is unusually high or low. A larger positive z-score means a value is far above the mean, while a large negative z-score indicates it lies far below the mean. These interpretations rely on the properties of the distribution’s center and spread rather than simple ranking.
Percentiles directly answer “what proportion is at or below this value?” while z-scores answer “how far, in standard deviations, is this value from the mean?”.
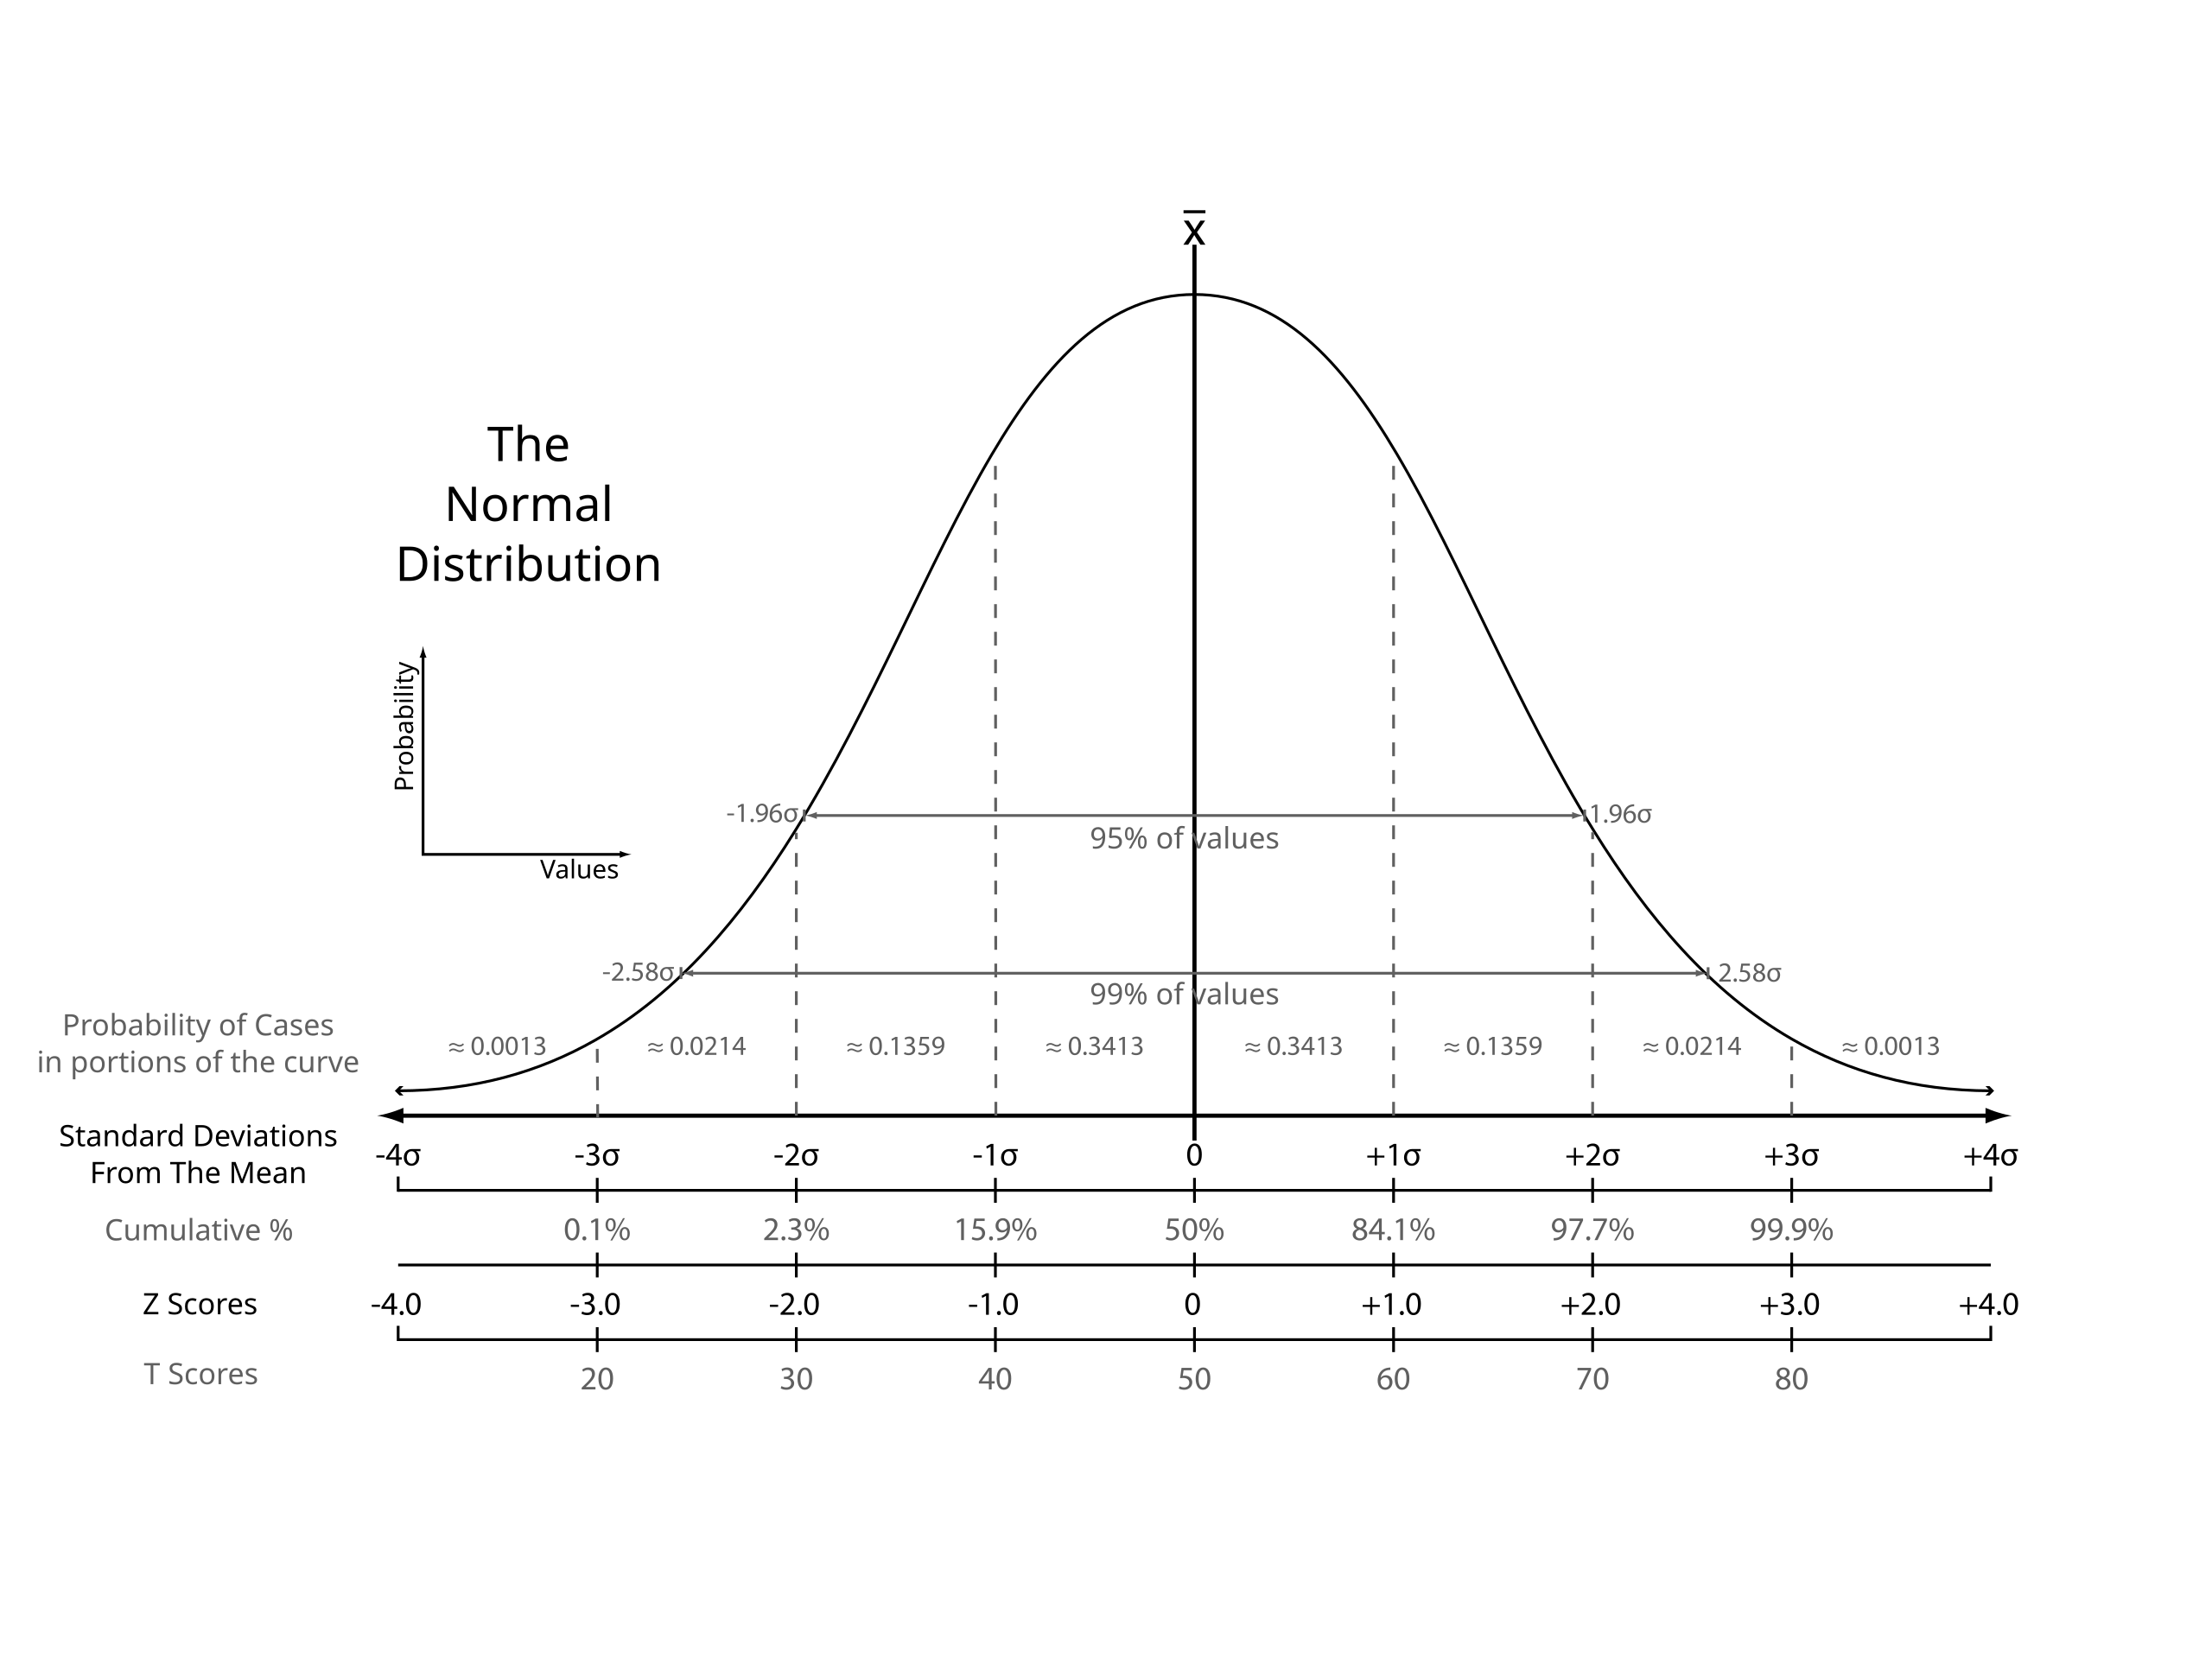
This standard normal distribution diagram shows z-scores aligned with cumulative percentages and percentile equivalents. It demonstrates how specific z-scores correspond to particular percentiles, such as 0 at the 50th percentile or ±1 near the 16th and 84th percentiles. The diagram includes T-scores, which exceed AP requirements but follow the same standardized framework. Source.
Comparing Percentiles and Z-Scores
Although both measures describe relative standing, percentiles and z-scores highlight different features of the distribution. Percentiles focus on ordering within the dataset, whereas z-scores incorporate the magnitude of deviation from the mean. This difference means the two measures are complementary rather than interchangeable.
Key Distinctions
Percentiles
Communicate relative rank.
Do not consider how far values are from the center.
Useful for non-normal or skewed distributions.
Z-scores
Communicate relative deviation using standard units.
Capture how unusual a value is.
Most interpretable when data are reasonably mound-shaped or symmetric.
Because the AP syllabus emphasizes effective comparison within and across datasets, students should be aware that percentiles may convey the general standing of a value, whereas z-scores provide a deeper quantification of the extremity of that standing.
Comparing Relative Positions Across Datasets
Comparisons across datasets often involve values measured in entirely different units or contexts. For instance, comparing heights measured in inches with test scores measured on a 100-point scale would make no sense using raw data alone. Standardizing with z-scores or expressing standing using percentiles eliminates these incompatible differences.
Important considerations when comparing values
Use percentiles when the goal is to understand rank or relative order.
Use z-scores when comparing across distributions with different centers or spreads.
Larger absolute z-scores indicate more extreme positions.
Higher percentiles indicate stronger relative standing within a dataset.
Context is essential: neither measure is meaningful without understanding the distribution under consideration.
These principles align with Skill 2.D, which focuses on mastering comparisons of relative position and understanding the implications of these measures for data analysis. Both percentiles and z-scores ultimately help reveal how data points relate to the broader distributions they belong to, supporting informed and context-rich statistical reasoning.
FAQ
A percentile is a data value, whereas a percentile rank is the proportion of observations at or below that value.
Understanding this difference matters because:
• Percentiles describe a specific point in the distribution.
• Percentile ranks describe where an individual value sits relative to the whole dataset.
• Confusing the two can lead to misinterpretation of a student’s standing, especially in skewed distributions.
Percentiles depend only on the ordering of values and do not capture how spread out the data are.
In skewed data, large jumps may occur between adjacent percentiles, giving a distorted impression of the difference between individuals.
Percentile gaps may appear equal even when the underlying values differ substantially, making comparisons less informative for magnitude-based analysis.
Yes, but with caution. Z-scores standardise values regardless of shape, yet their interpretability depends on distribution characteristics.
• If the distribution is heavily skewed or contains outliers, extreme z-scores may not reflect meaningful relative standing.
• Moderate z-scores (around –2 to +2) are generally more reliable for comparison across non-normal datasets.
• Interpretation should always consider context and shape.
A negative z-score indicates a value below the mean. Its magnitude reflects how far below the mean the value lies in units of standard deviation.
However, if the variability in the dataset is unusually large or the distribution is irregular, the magnitude may exaggerate or understate how atypical the value truly is.
Contextual understanding of distribution shape and spread is essential.
Conflicts typically occur in skewed or irregular distributions where percentiles and z-scores capture different aspects of position.
• Prioritise percentiles when the goal is ranking or understanding relative order.
• Prioritise z-scores when comparing deviations from the mean or making cross-dataset comparisons.
• If the discrepancy is large, examine the distribution shape to determine which measure better reflects meaningful differences.
Practice Questions
A student earns a test score that is at the 82nd percentile. What does this percentile tell you about the student’s performance relative to the rest of the group?
(1–3 marks available)
• 1 mark: States that the student performed better than 82% of the group.
• 1 mark: Recognises that the percentile indicates relative standing, not the raw score.
• 1 mark: Notes that 18% of students scored higher (or equivalent correct interpretation).
Two different exams are marked on different scales.
• Exam A scores have a mean of 70 and a standard deviation of 8.
• Exam B scores have a mean of 150 and a standard deviation of 20.
A student scores 86 on Exam A and 182 on Exam B.
(a) Calculate the z-score for each exam.
(b) Using the z-scores, determine on which exam the student performed better relative to the group.
(c) Explain why z-scores are an appropriate method for comparing the student’s performances on these two exams.
(4–6 marks available)
(a)
• 1 mark: Correctly calculates z-score for Exam A (z = 2).
• 1 mark: Correctly calculates z-score for Exam B (z = 1.6).
(Allow minor rounding differences.)
(b)
• 1 mark: States that the student performed better on Exam A.
• 1 mark: Justifies this by referring to the higher z-score.
(c)
• 1 mark: Explains that z-scores standardise scores by converting them into units of standard deviation.
• 1 mark: Explains that standardisation allows fair comparison across exams with different scales, means, or variability.
