
AP Syllabus focus: 'Identify questions that can be answered about possible relationships in data, recognizing that apparent patterns and associations may be random or may reflect a real relationship.'
Before using formal graphs or numerical summaries, AP Statistics begins with a basic question: do the data suggest that two variables are connected, or is the apparent pattern only chance?
What Investigating Relationships Means
In AP Statistics, you often start with two variables measured on the same individuals and ask whether they seem connected. If knowing the value of one variable helps you anticipate the value of the other, the variables may be related. The relationship may be obvious, subtle, or nonexistent, so the first step is to frame a question the data can actually answer.
Association: A relationship between two variables in which knowing the value of one variable gives information about the likely value of the other.
At this stage, the goal is not to prove a relationship with a statistic or model. The goal is to identify possible relationships and to avoid jumping too quickly from “I see a pattern” to “there is definitely a real connection.”
Questions worth asking
Useful questions about possible relationships usually ask whether one variable changes or differs when another variable changes or differs. For example, a statistical investigation might ask:
Do students with more sleep tend to report better concentration?
Are customers in different age groups equally likely to prefer the same product?
Do higher temperatures tend to occur with higher electricity use?
These are good statistical questions because they involve variability. You expect the answers to differ from one individual or group to another.
Variables, Individuals, and Context
To investigate a possible relationship, identify the individuals being studied and the two variables recorded for each one. The meaning of the variables matters. Context helps you decide what kind of relationship would make sense and what kind of result would be surprising.
A strong statistical question about a relationship usually has these features:
It compares or connects two variables
It is asked about a group, not a single person or object
It allows for different outcomes across observations
It can be answered using data rather than opinion alone
Context also affects interpretation. A pattern that seems important in one setting may be unremarkable in another. For that reason, AP Statistics expects you to describe relationships in context rather than with vague statements such as “they are related.”
Why Apparent Patterns Can Be Misleading
One of the most important ideas in this topic is that an apparent pattern may not reflect a genuine relationship. Data naturally vary, and variation can create patterns even when nothing meaningful is happening underneath.
Random variation: Natural differences in data that can create apparent patterns even when no real relationship exists.
Random variation is especially important when:
the number of observations is small
one or two unusual cases stand out
the difference between groups is slight
the pattern does not appear consistently across the data
Because of random variation, two variables can look related even if the pattern happened by chance.
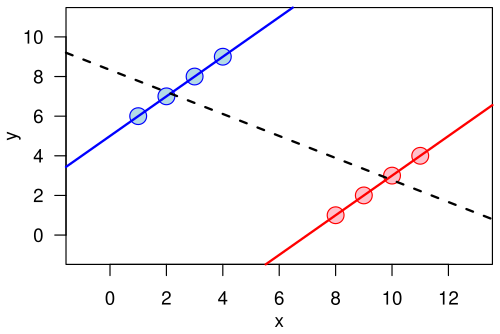
This diagram illustrates Simpson’s paradox: each subgroup shows a positive trend, but the combined data show a negative trend. It demonstrates why an apparent overall pattern can be misleading when an important grouping variable changes the interpretation of the association. Source
This is why careful statisticians avoid absolute claims based only on first impressions.
Distinguishing Chance from a Real Relationship
A key skill is learning to ask, “Could this pattern reasonably have happened just by chance?” If the answer might be yes, you should be cautious. If the pattern looks consistent, substantial, and sensible in context, then it may reflect something real.
Real relationship: A pattern in data that reflects an underlying association rather than a difference produced only by chance.
When deciding whether a relationship may be real, ask questions such as:
Is the pattern seen across many observations, or only a few?
Does the pattern match what the context would lead you to expect?
Is the apparent relationship large enough to matter?
Could another explanation make the pattern appear stronger than it really is?
Would the same general pattern likely appear again in another similar data set?
These questions do not prove a relationship, but they help you judge whether the observed association is worth taking seriously.
Careful Interpretation in AP Statistics
In AP Statistics, you should use cautious language when describing possible relationships. Good responses often say that the data suggest, indicate, or provide evidence of an association. They do not claim certainty unless stronger support exists.
It is also important to separate a relationship from a cause.
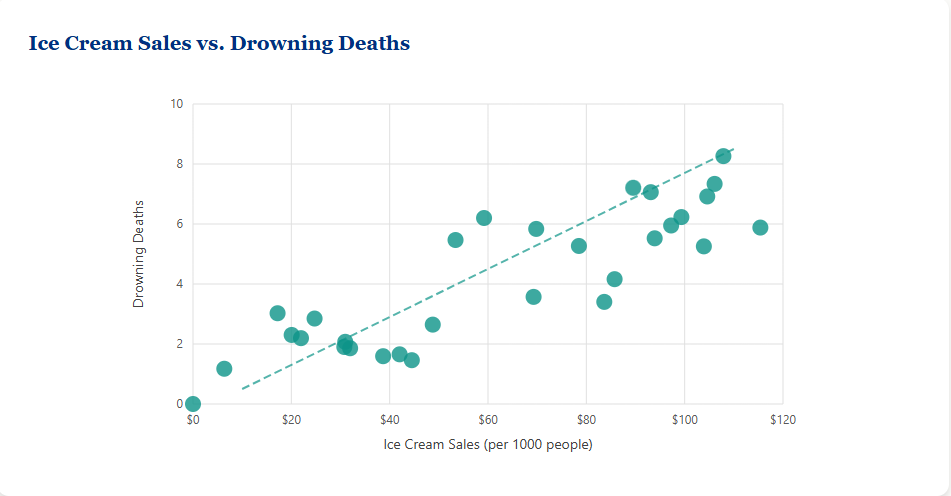
The figure shows a classic confounding setup where a third variable (temperature) creates a correlation between two variables that are not causally linked (ice cream sales and drownings). The accompanying causal diagram (DAG) reinforces the key idea that association can arise from shared causes, not just direct cause-and-effect. Source
Two variables may be associated without one directly causing the other. At this introductory stage, the safest claim is usually about association, not cause-and-effect.
Good phrasing for written responses
Useful language includes:
“The data suggest an association between the variables.”
“There appears to be a possible relationship.”
“The apparent pattern could be due to random variation.”
“The association may reflect a real relationship, but the data alone do not guarantee that.”
“A visible pattern does not automatically mean the variables are truly related.”
Careful statistical thinking begins by asking answerable questions, recognizing variation, and resisting the temptation to treat every pattern as meaningful.
Practice Questions
A teacher records the number of hours students slept the night before a test and whether each student reported feeling alert during class.
State one question about a possible relationship that can be answered with these data, and explain why an apparent pattern in the data might not represent a real relationship.
1 mark: States a valid question about whether sleep and alertness appear to be related.
1 mark: Explains that an apparent pattern could be due to random variation or chance rather than a real relationship.
A gardening club compares two groups of 25 tomato plants. One group receives fertilizer, and the other does not. At the end of the month, more plants in the fertilizer group have produced tomatoes. A student says, “This proves fertilizer causes tomato production.”
Evaluate the student’s claim using AP Statistics language. In your response, describe the possible relationship, explain why caution is needed, and identify two factors that would help determine whether the observed pattern reflects a real relationship.
1 mark: Identifies that the data suggest a possible association between fertilizer use and tomato production.
1 mark: States that the observed pattern might be due to random variation or chance.
1 mark: Explains that the data do not automatically prove causation.
1 mark: Identifies one relevant factor, such as sample size, consistency of the pattern, or whether the pattern is driven by a few unusual plants.
1 mark: Identifies a second relevant factor, such as study design, repeated results, or whether other conditions were similar across groups.
FAQ
Selection bias happens when the individuals included in the data are not representative of the broader group of interest.
If certain types of individuals are more likely to be included, the data may show a relationship that reflects the sampling process rather than the population. For example:
highly motivated people may be more likely to respond to a survey
customers with strong opinions may be more likely to leave reviews
This can make two variables appear related even when the pattern would weaken or disappear in a fairer sample.
A single study can be affected by chance, unusual conditions, or accidental imbalance.
Repeated studies are valuable because they show whether the same general pattern appears again. If a similar relationship shows up across multiple data sets, it becomes less believable that the original pattern was only random variation.
Repeated evidence does not guarantee truth, but it makes a supposed relationship more credible and more stable.
Yes. If a variable is measured imprecisely, the data may look messy even when an actual relationship exists.
Common problems include:
vague survey questions
inconsistent measuring tools
recording errors
categories that are too broad
Poor measurement can blur differences between individuals or groups. As a result, a real relationship may appear weak, unclear, or completely absent.
Some relationships depend on timing. A pattern that is visible in one season, month, or year may weaken or reverse in another.
This can happen because:
outside conditions change
behaviors change over time
one variable affects the other only after a delay
When time matters, combining all observations into one data set can hide important structure or create a misleading impression of the overall relationship.
Aggregated data combine many individuals into broad groups. That can hide important differences within groups.
A relationship seen in grouped data may not match the relationship at the individual level. In some cases, the grouped pattern can even point in a different direction from the individual pattern.
For that reason, the level at which data are collected and summarized matters when investigating whether variables are truly related.
