
AP Syllabus focus: 'Percentiles and z-scores can compare relative positions of points within a data set or between different data sets.'
Percentiles and z-scores answer a common statistical question: how a single observation stands relative to others. They help compare performances within one distribution and across distributions measured on different scales.
Relative position in a distribution
In statistics, a relative position tells where one value falls compared with the rest of a group. A raw score alone is often not enough. A score of 82 could be excellent in one class, average in another, and weak in a third, depending on the overall distribution.
When statisticians compare relative position, they ask questions such as:
How much of the data is below this observation?
How far is this observation from the center?
Is this value unusually high or low for its own data set?
One way to describe position is with a percentile.
Percentile: A measure of relative standing that tells the percent of observations at or below a given value in an ordered data set.
Percentiles depend on rank rather than on the actual numerical gaps between observations. That makes them useful even when the distribution is skewed or when the scale of measurement differs across groups.
A value at the higher percentile has a higher standing in its own distribution. If one student is at the 88th percentile and another is at the 73rd percentile, the first student scored at or above a larger share of the comparison group. The key idea is not the raw score itself, but the position of that score among all observations.
Standardizing with z-scores
Another way to compare relative position is with a z-score, which uses the mean and standard deviation of the distribution.
z-score: A standardized measure of relative position that tells how many standard deviations an observation is above or below the mean.
Unlike percentiles, z-scores describe distance from the mean in standardized units.
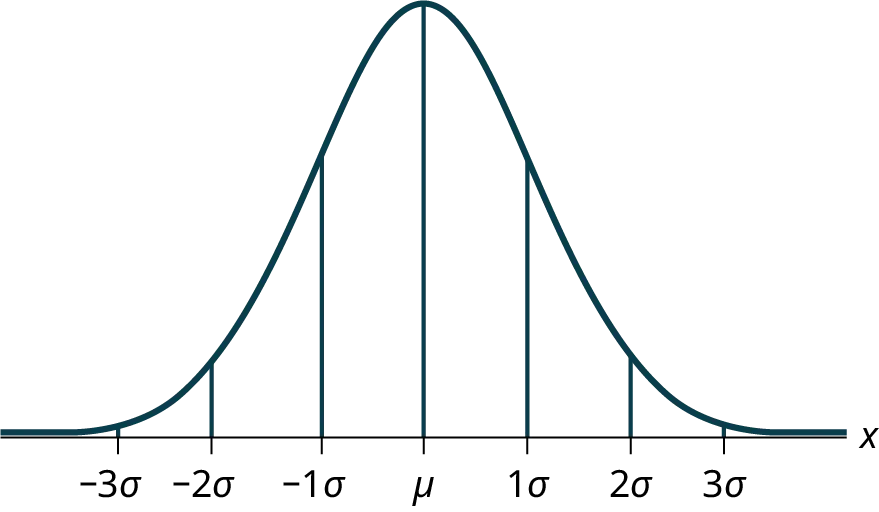
A normal (bell-shaped) curve marked at . The vertical reference lines emphasize that z-scores measure standardized distance from the mean in units of the standard deviation. Source
This can be especially useful when two data sets use different numerical scales.
For a quantitative value, the z-score is found by standardizing the distance from the mean.
= standardized score
= observed value
= mean of the distribution
= standard deviation of the distribution
When sample statistics are used, may be replaced by and by .
The sign and size of a z-score carry the meaning:
Positive z-score: the value is above the mean.
Negative z-score: the value is below the mean.
z-score near 0: the value is close to the mean.
Larger absolute value of z: the value is farther from the mean and more unusual relative to that distribution.
Comparing positions within one data set
Within a single distribution, both percentiles and z-scores can rank observations.
Percentiles are often easiest when the main goal is to describe standing. A higher percentile means a stronger position in the ordered data. This is especially natural for test scores, growth charts, or any context where rank matters more than exact distance.
Z-scores are more informative when the distance from the mean matters. Two observations may have nearby percentiles but noticeably different z-scores if one lies much farther from the mean in standard deviation units. In that case, the z-score gives more detail about how unusual the value is.
When comparing two points in the same data set:
The observation with the higher percentile has more observations below it.
The observation with the higher z-score is relatively farther above the mean.
If both measures point to the same value as higher, the comparison is straightforward.
Comparing positions between different data sets
Comparisons across different data sets are common in AP Statistics. Raw values alone can be misleading because the centers, spreads, and scales may differ.
Percentiles allow comparison by rank within each group. If one observation is at the 91st percentile in one data set and another is at the 84th percentile in a different data set, the first observation has the stronger relative standing in its own group.
Z-scores allow comparison by standardized distance from the mean. If one value has and another has , the first value is farther above its group mean relative to that group’s spread. This makes z-scores especially helpful when data sets are measured in different units or have different standard deviations.
However, the two measures are not identical in meaning:
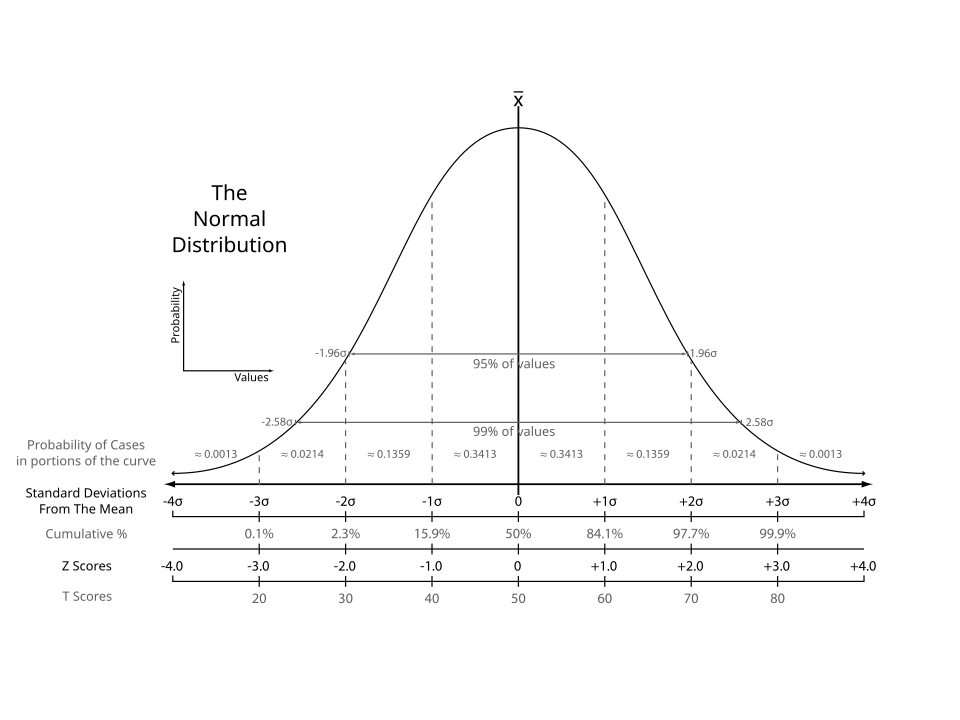
A normal distribution annotated with standard-deviation tick marks and multiple aligned scales, including z-scores and percentile equivalents. It helps students see how rank (percentile) and standardized distance (z-score) correspond on a bell-shaped model, while still representing different kinds of information. Source
Percentiles compare rank.
z-scores compare distance from the mean after standardizing.
Because of this, the better measure depends on the question being asked.
Choosing between percentiles and z-scores
Use percentiles when:
the goal is to compare rank or standing,
the context naturally describes performance by percent below,
or the distribution is irregular enough that ranking is more meaningful than distance from the mean.
Use z-scores when:
the goal is to compare how far values are from their means,
the data are quantitative,
and the distributions are similar enough that mean and standard deviation give useful summaries.
A percentile does not tell how tightly packed the data are near that value. A z-score does not tell what proportion of observations are below the value unless extra distribution information is available. For that reason, percentiles and z-scores answer related but different questions about relative position.
Interpreting comparisons in context
On AP Statistics problems, interpretation matters as much as computation. A correct comparison should always name the measure being used and connect it to the data set.
Strong contextual statements usually:
identify whether the comparison is based on percentile or z-score,
state which observation has the higher relative position,
and explain what that means within the relevant group.
Avoid comparing raw scores from different settings without standardizing or using rank. Also avoid saying that one value is "better" unless the context supports that word. In statistics, the precise claim is usually that one value is higher relative to its distribution.
Practice Questions
A student is at the 64th percentile in biology and the 81st percentile in U.S. history. In which class did the student perform better relative to classmates? Justify your answer.
1 mark: Identifies U.S. history.
1 mark: Justifies that the 81st percentile means the student scored at or above a larger proportion of that class than the 64th percentile does in biology.
A student took two different assessments.
On a math test, the student scored 78. The class mean was 70 with standard deviation 5.
On a reading test, the student scored 540. The test mean was 500 with standard deviation 30.
Calculate the student’s z-score for each assessment.
On which assessment did the student have the stronger relative position?
Interpret your answer in context.
1 mark: Uses the z-score formula correctly for math.
1 mark: Finds math z-score as .
1 mark: Uses the z-score formula correctly for reading.
1 mark: Finds reading z-score as .
1 mark: States that the student had the stronger relative position on the math test and interprets this as being farther above the mean, in standard deviation units, than on the reading test.
FAQ
A percentage score tells how much of the possible points were earned.
A percentile tells how a score compares with other scores.
For example, a score of $90%$ means 90 percent of the points were earned. A score at the 90th percentile means the score is at or above about 90 percent of the comparison group. Those are not the same idea.
Yes.
This can happen when the students are in different data sets with different shapes, means, and standard deviations. Being at the same percentile means they have similar rank positions within their own groups, but the actual standardized distance from the mean can still differ.
It can also happen when percentile ranks are rounded.
Percentile ranks are usually easier for non-specialists to understand.
They answer an intuitive question: “What share of the group scored at or below this student?” That is often more meaningful to students, families, and administrators than “how many standard deviations from the mean.”
Percentiles also avoid requiring the audience to know the group mean and standard deviation.
Ties can make percentile reporting less exact because many observations share the same value.
Different organizations may use slightly different rules for handling ties, such as:
counting all tied values as below,
counting some as below and some as above,
or using an average rank.
Because of this, percentile values from different sources may differ slightly even when the underlying data are similar.
Yes.
A z-score depends only on where the value falls relative to its own mean. If a group’s mean is very high, then a raw score that seems high in everyday terms can still be below that group average and therefore have a negative z-score.
The sign of the z-score reflects relative position, not whether the raw score is large or small by itself.
