
AP Syllabus focus:
‘- Introduction to two-way (contingency) tables as a method for summarizing data involving two categorical variables, with focus on understanding how the tables display frequency counts or relative frequencies.
Explaining how to calculate and interpret joint relative frequencies, with detailed guidance on understanding cell frequencies relative to the table’s total.
Skill 2.D: Enhancing skills in creating, using, and interpreting two-way tables to summarize and analyze relationships between two categorical variables.
Essential Knowledge UNC-1.P.3 & UNC-1.P.4: Mastery of constructing two-way tables and calculating joint relative frequencies for comprehensive data analysis.’
Two-way tables are essential tools for organizing data from two categorical variables, helping reveal patterns, associations, or distinctions through structured frequency displays.
Understanding Two-Way (Contingency) Tables
A two-way table organizes counts or proportions for two categorical variables, allowing us to examine how categories of one variable distribute across categories of another. When constructing a table, each cell corresponds to a combination of categories, forming the foundation for deeper analysis.
Two-Way Table: A rectangular arrangement displaying the frequency counts or relative frequencies for all combinations of two categorical variables.
Because two-way tables summarize categorical data efficiently, they are central to identifying possible relationships without implying causation. Each row and column represents categories of separate variables, and each interior cell shows how many observations fall into both categories simultaneously.
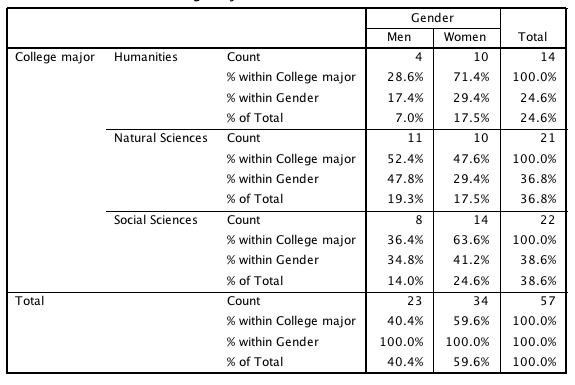
This table illustrates how a two-way layout organizes combinations of two categorical variables and includes both counts and cell percents as joint relative frequencies. Source.
Components of a Two-Way Table
When reading or creating a table, it is important to understand its structural elements:
Rows represent the levels of one categorical variable.
Columns represent the levels of the second categorical variable.
Cell entries represent frequencies or relative frequencies.
Row totals and column totals summarize marginal counts.
The grand total represents the number of all observations.
These components help determine where patterns may exist and whether categories differ meaningfully across variables.
Joint Relative Frequencies
A central focus of this subsubtopic is the computation and interpretation of joint relative frequencies, which express how often specific category combinations occur relative to the entire data set.
Joint Relative Frequency: The proportion of observations that fall into a specific cell of a two-way table, calculated by dividing the cell count by the table’s grand total.
Joint relative frequencies allow comparisons across cells on a common scale, making it easier to assess the overall distribution of combined categorical outcomes.
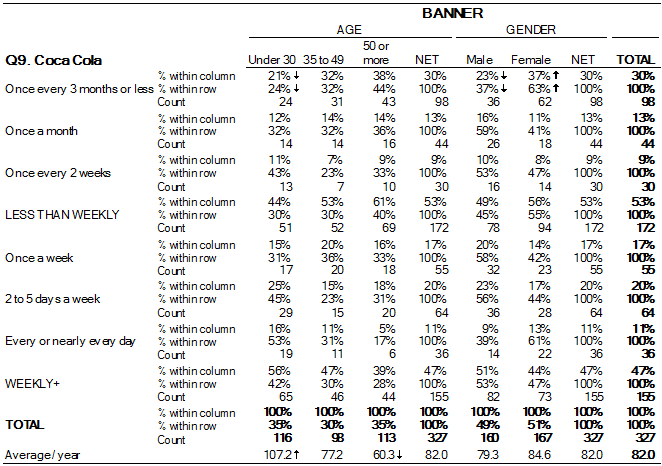
This crosstab demonstrates how cell values represent combined categories and can be interpreted using joint relative frequencies. It includes an additional layer of detail beyond two-variable tables but preserves the same structural principles. Source.
Calculating Joint Relative Frequencies
To compute joint relative frequencies, follow a clear and systematic process:
Identify the cell count representing the combination of interest.
Determine the grand total of all observations in the table.
Divide the cell count by the grand total.
Express the result as a proportion or percentage, depending on context.
Interpret the value relative to the overall data set.
This set of steps aligns precisely with Essential Knowledge UNC-1.P.3 and UNC-1.P.4, which emphasize both the construction of two-way tables and the accurate calculation of joint relative frequencies. A calculated frequency becomes meaningful only with clear interpretation, so students should always articulate what the value represents in terms of the two categorical variables.
Frequency Types in Two-Way Tables
Two-way tables may display either raw counts or relative frequencies. Understanding the differences strengthens the ability to analyze relationships:
Frequency counts report the number of observations in each cell.
Relative frequencies report proportions of observations, making comparisons easier.
Joint relative frequencies demonstrate how often category combinations occur.
Marginal relative frequencies summarize totals for each category relative to the grand total.
Conditional relative frequencies (not the focus here) show proportions within a row or column.
Joint relative frequencies remain the primary analytical tool for this subsubtopic, particularly when distributions need to be compared across the entire sample.
Why Two-Way Tables Matter for Analyzing Categorical Data
Two-way tables contribute to understanding relationships by:
Providing a visual and numerical structure for data organization.
Allowing clear comparisons between categories.
Supporting identification of potential associations.
Highlighting patterns that may warrant deeper investigation.
Offering a foundation for more advanced summaries and graphical displays.
Even when patterns appear strong, students must remember that such tables reveal associations, not causes. Apparent trends may occur due to randomness, lurking variables, or sampling variation.
Constructing a Two-Way Table
Skillful construction of a two-way table ensures accuracy and interpretability. Students should follow this process:
Determine the two categorical variables involved.
Identify all categories for each variable.
Collect and classify all observations into appropriate cells.
Calculate row and column totals.
Compute joint relative frequencies when needed.
Confirm that all values sum to the grand total.
These steps reinforce Skill 2.D, encouraging consistent, logical organization of categorical data.
Interpreting Two-Way Tables with Joint Relative Frequencies
Interpretation involves reasoning about the relationships represented. Consider these guiding ideas:
Look for cells with unusually high or low joint relative frequencies.
Compare proportions across different categories to evaluate association.
Use row and column totals to contextualize joint frequencies.
Consider whether patterns are meaningful or likely due to random variation.
Interpretation should remain disciplined and cautious. While two-way tables provide powerful insight, any suggested relationship is observational and does not imply causation.
Using Joint Relative Frequencies to Explore Associations
Joint relative frequencies help identify potential associations by revealing where particular combinations of categories are more or less common than expected. Students should:
Examine whether proportions differ meaningfully across the table.
Determine whether the distribution of one variable changes depending on the category of the other.
Recognize when values appear too similar to indicate any strong relationship.
Evaluate whether additional analysis or data representation is needed.
Such reasoning supports a deeper understanding of how categorical variables interact in real data scenarios, tying directly to the skills outlined in the AP Statistics curriculum.
FAQ
Two-way tables alone cannot confirm whether differences are statistically meaningful, but they help highlight where those differences appear.
Look for:
Large contrasts between joint relative frequencies
Patterns where one category combination appears consistently more common
Cells with unexpectedly high or low proportions
Such patterns suggest where further statistical tools (like chi-square tests, taught later in the course) might be appropriate, even though this subsubtopic focuses only on summarisation.
Unequal group sizes can make raw counts seem more extreme or less meaningful.
To avoid misinterpretation:
Use relative frequencies rather than counts when comparing groups
Check marginal totals to confirm whether one category dominates
Focus on proportions rather than absolute numbers
This ensures comparisons are fair when categories differ in size.
Two-way tables work best when:
Both variables are categorical
Categories are mutually exclusive
Each individual can only be counted once
They become less appropriate when there are many categories, as the table becomes unreadable, or when variables allow multiple selections per individual.
Two-way tables can include missing data, but it must be treated carefully.
Options include:
Adding a “missing/unknown” category for each variable
Excluding cases with missing values, but only when justified
Reporting how many observations were removed
Transparency is essential so that proportions are interpreted correctly.
Common errors include:
Confusing joint relative frequencies with conditional relative frequencies
Comparing raw counts instead of proportions
Ignoring the grand total when interpreting proportions
Assuming a relationship implies causation
Being clear about what reference total is used prevents misinterpretation and supports accurate reasoning.
Practice Questions
Question 1 (1–3 marks)
A school surveyed students about whether they prefer reading fiction or non-fiction and whether they read daily or less often. The survey results are summarised using a two-way table. Explain what a joint relative frequency represents in this context and describe how it would be calculated for the combination “prefers fiction and reads daily”.
Question 1
1 mark for stating that a joint relative frequency is the proportion of all surveyed students who fall into a specific combination of categories.
1 mark for describing that it is calculated by dividing the number of students who prefer fiction and read daily by the total number of students surveyed.
1 mark for expressing clearly that it represents how common that specific combination is within the whole group.
Question 2 (4–6 marks)
A researcher records whether adults choose tea or coffee and whether they usually drink their chosen beverage in the morning or afternoon. The data are summarised using a two-way table containing only frequency counts.
(a) Describe the steps needed to calculate the joint relative frequency for “chooses coffee and drinks in the afternoon”.
(b) Explain how joint relative frequencies could be used to explore whether there is an association between beverage choice and time of consumption.
(c) State one limitation of using only joint relative frequencies when trying to determine whether a real association exists.
Question 2
(a)
1 mark for stating the need to identify the frequency count for adults who choose coffee and drink in the afternoon.
1 mark for stating that the grand total of all adults surveyed is required.
1 mark for stating that the joint relative frequency is obtained by dividing the identified cell count by the grand total.
(b)
1 mark for explaining that comparing proportions across combinations shows whether some beverage–time pairs occur more or less often than expected.
1 mark for describing that noticeable differences between joint relative frequencies suggest a possible association.
(c)
1 mark for identifying a limitation, such as joint relative frequencies alone cannot confirm causation, may be influenced by sample size, or cannot rule out random variation.
