
AP Syllabus focus: 'A conditional relative frequency describes a specific part of a contingency table, such as cell frequencies in a row divided by that row total.'
Conditional relative frequencies help you focus on one group at a time in a two-way table, so you can describe proportions within that group rather than within the full data set.
What Conditional Relative Frequencies Measure
In a contingency table, each cell records the count for one category of one variable together with one category of a second variable.
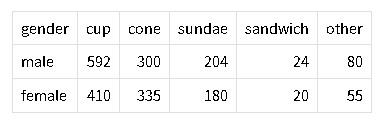
This reference diagram depicts the structure of an contingency table, emphasizing how counts are organized into cells formed by row–column intersections. It supports the idea that conditional relative frequencies come from choosing a condition (a row or column) and comparing a cell count to that row/column total. Source
A conditional relative frequency focuses on one part of that table after fixing a condition. Instead of comparing a cell to the total number of observations, you compare it to the total for the group named in the condition.
Conditional relative frequency: A proportion found by dividing a cell frequency by the total of the row or column that is being treated as the condition.
This idea is built around the word given. If a question asks for the proportion of individuals in one category given that they belong to another category, the second category becomes the condition. That group provides the denominator.
The role of the condition
The condition tells you which group becomes the reference group. Common wording includes:
given that
among
out of those who
for the group
within the category
Each of these phrases signals that you are restricting attention to one row or one column.
Once that restriction is made, the conditional relative frequency describes a part of that restricted group, not a part of the entire table.
How to Calculate a Conditional Relative Frequency
To calculate a conditional relative frequency, first identify the cell of interest. Then identify the total for the row or column named in the condition. Only after the denominator is fixed should you divide.
= count in the selected cell
= total count in the row named in the condition
= total count in the column named in the condition
A conditional relative frequency can be written as a decimal, fraction, or percent. In AP Statistics, the most important feature is not the form of the answer but whether the denominator matches the condition given in the problem.
A reliable process
Read the question carefully and identify the conditioned group.
Locate the relevant cell count.
Locate the total for the row or column named in the condition.
Divide the cell count by that row or column total.
State the answer in context, naming both the subgroup and the conditioned group.
If the condition is based on a row, the conditional relative frequencies across that row should add to 1, aside from small rounding differences. If the condition is based on a column, the conditional relative frequencies down that column should add to 1.
Interpreting the Result in Context
A conditional relative frequency describes a within-group proportion. It answers a question about one category inside another category. It does not describe the proportion in the entire data set, and it does not automatically describe the reverse condition.
For instance, a statement such as “the conditional relative frequency of commuters who bike, given that they live within two miles of campus” means that you begin with the group who live within two miles, then find what proportion of that group bikes.
Writing interpretations clearly
A strong interpretation usually does four things:
names the conditioned group first,
names the category of interest second,
reports the proportion or percent,
keeps the statement tied to the context of the data.
Useful sentence starters include:
“Among students who …”
“Of the adults in the … group, …”
“Within the category …, the proportion that … is …”
This order matters because the denominator is part of the meaning. If you do not identify the conditioned group clearly, the number can be misunderstood.
Row Conditions and Column Conditions
Conditional relative frequencies can be computed by rows or by columns. Neither direction is automatically correct. The correct direction depends entirely on the wording of the question.
If the condition names a row category, divide by the row total. If the condition names a column category, divide by the column total. A common AP Statistics mistake is to choose a denominator based on where the numbers are easiest to see rather than on what the question actually asks.
Another common error is to reverse the condition.
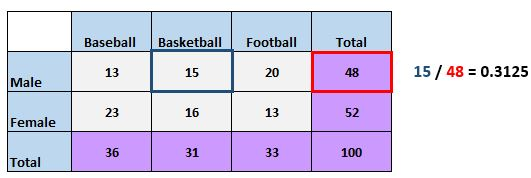
These worked examples illustrate conditional relative frequencies computed by conditioning on a row versus conditioning on a column. The same two-way table is used to answer different “given that …” questions, emphasizing that the denominator must match the conditioned group (row total or column total). Source
The proportion of athletes who are juniors is not the same as the proportion of juniors who are athletes. The same cell count may appear in both calculations, but the denominator changes, so the conditional relative frequency usually changes as well.
Common Mistakes to Avoid
Using the grand total: that produces an overall relative frequency, not a conditional relative frequency.
Ignoring the wording: phrases like among or given that determine the denominator.
Switching rows and columns: the denominator must match the conditioned category.
Reporting only a number: the answer should identify the group being described.
Confusing a count with a proportion: the cell entry is often a count, but the conditional relative frequency is found only after division.
Rounding too early: keep enough decimal places until the final reported answer.
A quick self-check is to ask, “What group am I dividing by?” If that group matches the condition in the question, the setup is likely correct.
Practice Questions
A survey of 90 students found that 54 students own a graphing calculator and 36 do not. Of the 54 students who own a graphing calculator, 45 are enrolled in AP Statistics. Find the conditional relative frequency of being enrolled in AP Statistics given that the student owns a graphing calculator.
1 mark for using the correct denominator of 54.
1 mark for giving the correct conditional relative frequency, or about 83.3%.
A school surveyed students about whether they have a part-time job and whether they participate in a school club.
Among students with a part-time job, 28 participate in a club and 52 do not.
Among students without a part-time job, 63 participate in a club and 57 do not.
(a) Find the conditional relative frequency of club participation for students with a part-time job.
(b) Find the conditional relative frequency of club participation for students without a part-time job.
(c) Write a sentence comparing these two conditional relative frequencies in context.
(d) Explain why dividing by the total number of surveyed students would not answer parts (a) and (b).
(a)
1 mark for using the correct denominator of 80.
1 mark for the correct value, or 35%.
(b)
1 mark for using the correct denominator of 120.
1 mark for the correct value, or 52.5%.
(c)
1 mark for a correct contextual comparison, such as noting that club participation is more common among students without a part-time job.
(d)
1 mark for explaining that parts (a) and (b) ask for within-group proportions, so each denominator must be the total for the relevant job-status group rather than the overall survey total.
FAQ
Raw counts can be misleading if one group is much larger than another.
Conditional relative frequencies adjust for group size by turning counts into within-group proportions. That makes it easier to judge how common a category is inside each group, even when the groups are unequal.
For example, a larger count in one group does not necessarily mean a larger proportion if that group also has many more individuals overall.
No, not mathematically.
If the data are organized correctly, the same conditional question should give the same answer whether the categories are written in rows or columns. What matters is choosing the denominator that matches the condition.
The layout may change where you look, but it should not change the meaning of the calculation.
A conditional relative frequency cannot be computed if the conditioned group has total size 0.
That is because division by 0 is undefined. In context, it means there were no individuals in that group, so there is no basis for describing a proportion within it.
On an exam, state clearly that the conditional relative frequency is undefined because the conditioned group contains no observations.
Missing responses can change the denominator, so they must be handled carefully.
If missing responses are included as their own category, they become part of the table.
If missing responses are excluded, the conditional relative frequencies are based only on the remaining observations.
The key is consistency. Your denominator should match the group actually represented in the table or described in the question.
Yes, but only if the percentages are based on compatible totals.
If all the percentages come from the same conditioned group, you can use them directly. If the percentages come from different bases, you cannot combine them without first knowing the original denominators.
When possible, counts are safer because they make the denominator explicit.
