
AP Syllabus focus: 'Marginal relative frequencies are the row and column totals in a two-way table divided by the total for the entire table.'
Understanding marginal relative frequencies helps you describe the overall makeup of categorical data. They show how much of the full data set falls into each row category or column category, using proportions rather than raw counts.
What Marginal Relative Frequencies Mean
A marginal relative frequency comes from the totals written in the margins of a two-way table.
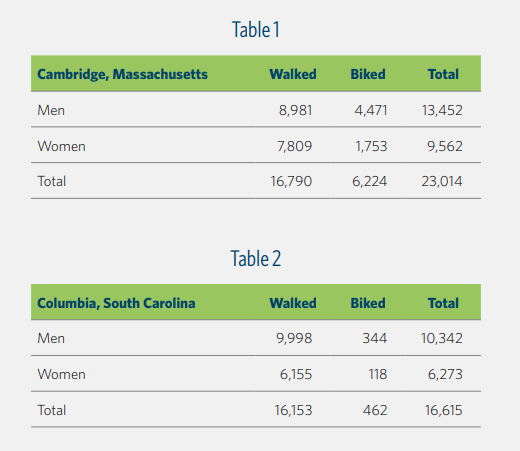
Two-way frequency tables showing counts, with row totals and column totals placed along the table margins and the grand total in the bottom-right corner. This layout makes it easy to see exactly which totals are considered “marginal” before converting them into proportions of the entire sample. Source
Marginal relative frequency is a row total or column total divided by the grand total of all observations in a two-way table.
The word marginal refers to the outer edges of the table, where the row totals and column totals are usually placed. These totals summarize each categorical variable separately. When divided by the overall total, they tell you the proportion of all individuals that fall into a given category.
For AP Statistics, this matters because raw totals can be difficult to compare across data sets of different sizes. Relative frequencies turn counts into proportions or percentages, making the overall distribution easier to read and interpret.
Row Margins and Column Margins
In a two-way table, there are two sets of margins:
Row totals, found at the end of each row
Column totals, found at the bottom of each column
Each row total can be turned into a row marginal relative frequency. Each column total can be turned into a column marginal relative frequency.
These values describe the overall proportion in each category of one variable, without focusing on any single interior cell of the table. A marginal relative frequency does not come from the body of the table. It comes from a total along the edge, compared with the grand total.
How to Calculate Them
The calculation is straightforward once the row totals, column totals, and grand total are known.
= row total or column total count
= total number of observations in the table
You can use this same rule for any category on either margin. The only thing that changes is which row total or column total you choose.
Process
Identify the category whose marginal relative frequency is requested.
Find the row total or column total for that category.
Find the grand total for the entire two-way table.
Divide the marginal total by the grand total.
Report the result as a decimal or a percentage, depending on the question.
If you calculate all row marginal relative frequencies for one variable, they add to 1, or to 100% if written as percentages.
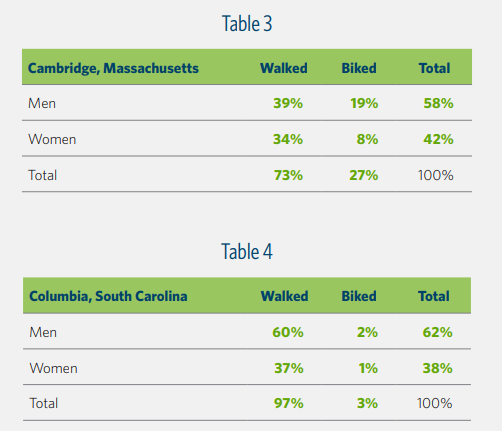
Two-way tables expressed in relative frequencies (percentages), where the totals on the right and bottom margins represent marginal relative frequencies for each category. The 100% entries in the Total row/column highlight the normalization check: a full set of marginal relative frequencies for a variable should sum to 1 (or 100%). Source
The same is true for all column marginal relative frequencies for the other variable.
This gives you a useful accuracy check. If a full set of marginal relative frequencies does not add to 1 because of exact values, or to approximately 1 because of rounding, you should recheck the totals and the denominator you used.
How to Interpret Them in Context
A marginal relative frequency should always be interpreted as an overall proportion of the entire data set.
When you interpret one, your statement should focus on all individuals in the table, not just those from a single row or single column. The key idea is that the denominator is always the grand total. Because of that, a marginal relative frequency can be read as the proportion of all observations that belong to one category.
Good interpretations usually include:
the category being described
the proportion or percentage
a reference to the entire group of observations
This makes the meaning clear. A statement such as “0.42 of the data are in this category” is less complete than “42% of all individuals in the study are in this category.”
Why They Matter
Marginal relative frequencies help you describe the overall composition of a sample or population. They are useful when you want to answer questions such as:
What proportion of all observations belong to a certain category?
Which category is most common overall?
How is one variable distributed in the full data set?
Because they do not use the interior cell-by-cell breakdown, they provide a broad summary instead of detailed cross-classification.
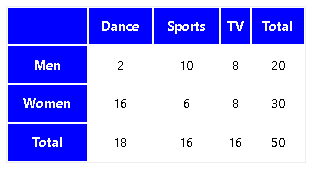
Segmented bar chart that visualizes the distribution of a categorical response across groups, using bar segments to represent proportions. This type of graph complements marginal relative frequencies by making overall composition and between-group differences easier to compare at a glance. Source
Common Mistakes to Avoid
Students often make predictable errors with marginal relative frequencies.
Using the Wrong Total
The most common mistake is dividing by a row total or column total instead of the grand total. For a marginal relative frequency, the denominator must be the total number of observations in the entire table.
Using a Cell Count Instead of a Margin
A count inside the body of the table is not a marginal total. To find a marginal relative frequency, you must use a total from the table’s edge.
Forgetting There Are Two Sets
A two-way table has:
one set of marginal relative frequencies for the row variable
another set of marginal relative frequencies for the column variable
These are different summaries, even though both use the same grand total. Also, do not mix counts from one set with percentages from the other when comparing categories.
Giving an Incomplete Interpretation
An answer without context may not earn full credit. Be specific about what category the proportion describes and make clear that it is based on the entire data set.
AP Exam Tips
On AP Statistics questions, the wording often signals exactly what you need to compute.
Look for phrases such as:
overall proportion
of all individuals
row total divided by the grand total
column total divided by the grand total
If the problem asks for a marginal relative frequency, do not search inside the table for a single cell value. Instead, go straight to the totals along the margins.
When writing your answer:
include the numerical proportion or percentage
name the category clearly
interpret it in the context of the whole study
check that your value is reasonable given the total size of the data set
Practice Questions
A two-way table records 300 voters by age group and preferred news source. The row total for voters ages 18 to 29 is 84.
Find the marginal relative frequency for voters ages 18 to 29, and interpret it in context.
1 mark for calculating or 28%
1 mark for a correct interpretation, such as: 28% of all voters in the table are ages 18 to 29
A survey of 400 students classifies each student by grade level and primary after-school activity.
The row totals for grade level are: 9th grade: 110 10th grade: 96 11th grade: 104 12th grade: 90
The column totals for primary after-school activity are: Sports: 150 Job: 82 Clubs: 68 Home/Family responsibilities: 100
(a) Find the marginal relative frequency for 11th-grade students.
(b) Find the marginal relative frequency for students whose primary after-school activity is sports.
(c) Which is greater, the marginal relative frequency for 9th grade or the marginal relative frequency for home/family responsibilities? Justify your answer.
(d) Explain what the full set of grade-level marginal relative frequencies represents in context.
1 mark for (a): or 26%
1 mark for (b): or 37.5%
1 mark for (c): identifying 9th grade as greater
1 mark for (c): justification using and
1 mark for (d): explaining that the grade-level marginal relative frequencies describe the distribution of all students across grade levels out of the entire survey
FAQ
Marginal relative frequencies use only the totals on the outside of the table. They do not use the individual cell counts inside the table.
Because of that, different interior arrangements can produce the same row and column margins. Marginal relative frequencies summarize overall composition, not the full internal structure of the data.
Yes. If one individual is selected at random from the group represented by the table, a marginal relative frequency can be interpreted as the probability that the person falls in that category.
In a sample, this is an empirical probability based on observed data. In a census or complete population count, it is the exact population proportion.
Missing responses matter because they change the denominator. If incomplete cases are removed, the grand total becomes smaller, so every marginal relative frequency may change.
Some studies treat missing responses as their own category, while others exclude them entirely. On an AP Statistics problem, use whatever convention the question states and be clear about which total is being used.
Software often keeps more decimal places than you write by hand, so small differences may come from rounding.
Also, some programs default to row percentages or column percentages instead of marginal relative frequencies. Before trusting the output, check that the denominator is the grand total for the entire table.
No. Rearranging the order of rows or columns changes only where the categories appear, not the totals themselves.
As long as the category counts and the grand total stay the same, each marginal relative frequency stays the same. Only the display changes, not the underlying proportions.
