
AP Syllabus focus: 'Correlation is unit-free and always between -1 and 1. Values of 0, 1, and -1 describe no linear association or perfect linear association.'
Interpreting correlation means reading both the sign and the size of correctly. On the AP exam, precise language matters because the number describes only linear association and carries no units.
What the correlation coefficient tells you
The correlation coefficient, written as , summarizes the direction and strength of a linear association between two quantitative variables. It is a single number, so its meaning depends on careful interpretation rather than on the value alone.
Correlation coefficient: A statistic, denoted by , that describes the direction and strength of a linear association between two quantitative variables.
When you interpret correlation, focus on two features at the same time:
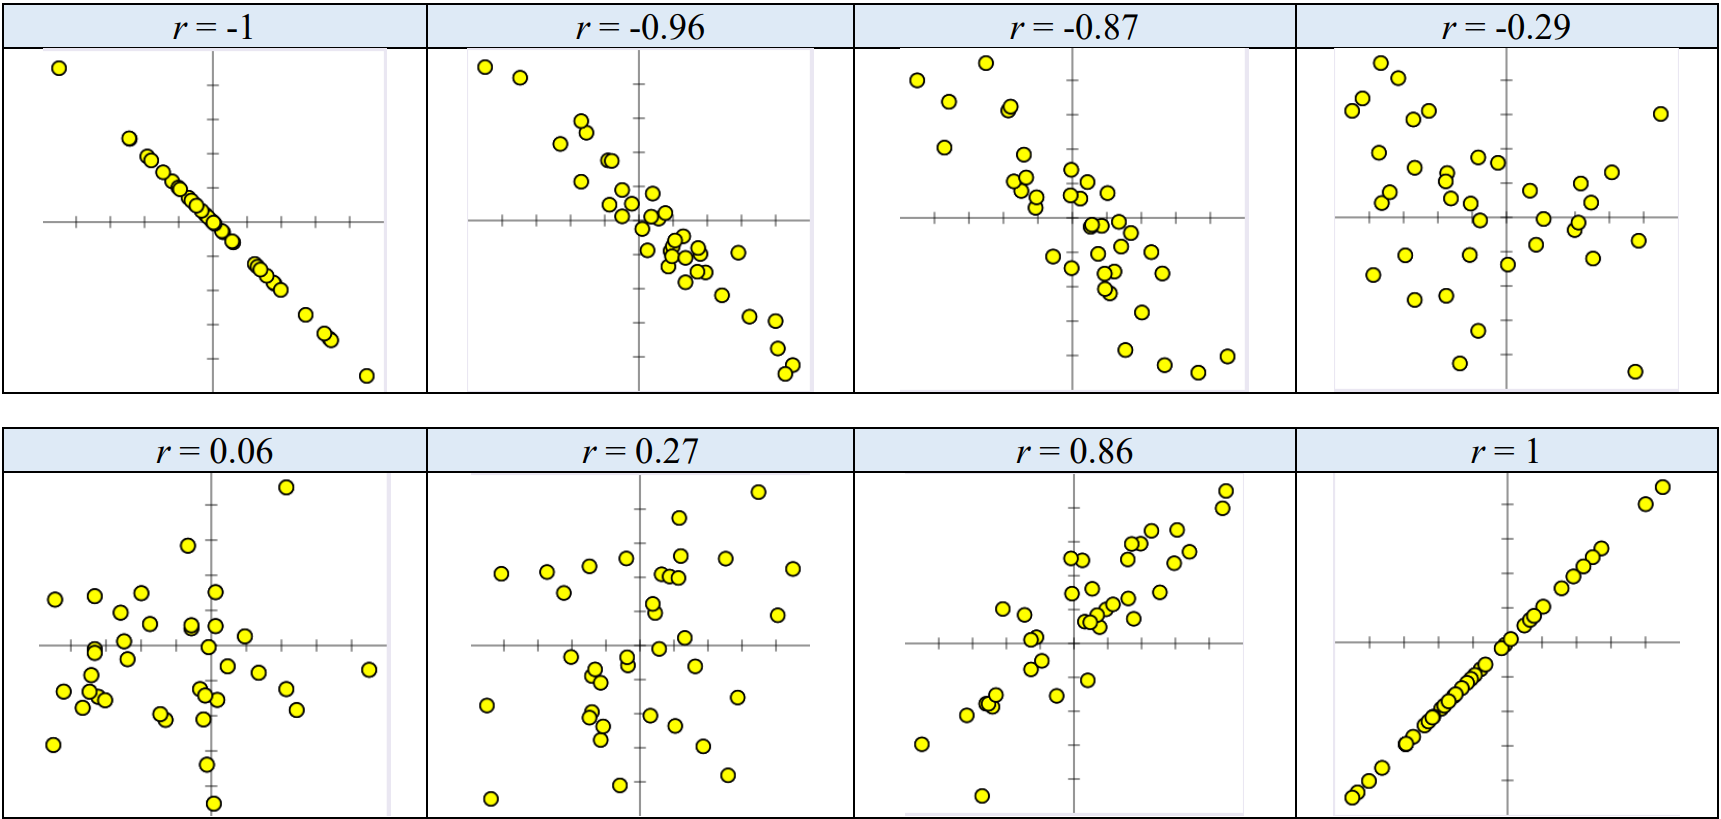
A set of eight scatterplots shows how the sign of determines direction (upward vs. downward trend) while the magnitude determines strength (tight vs. diffuse clustering around a line). The endpoints and display perfect linear patterns with no scatter, while values near show weak linear association. Source
the sign of , which tells the direction of the linear association
the magnitude of , which tells how strong the linear association is
A correct interpretation should always use the word linear.
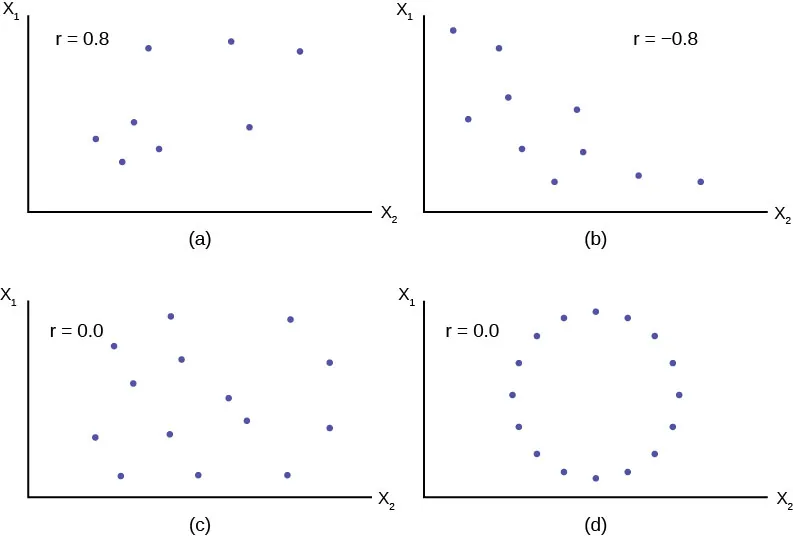
Four scatterplots illustrate how captures linear association: positive, negative, and zero. The final panel shows a strong non-linear pattern with , emphasizing that correlation measures only straight-line structure (not “relationship” in general). Source
Correlation does not describe every possible relationship between variables; it specifically describes how well the points follow a straight-line pattern.
Unit-free and bounded values
One of the most important facts about correlation is that it is unit-free. This means the value of does not depend on the measurement units used for the variables. If height is measured in inches instead of centimeters, or time in minutes instead of seconds, the correlation stays the same.
Because correlation is unit-free:
it has no label
it is not measured in dollars, inches, percentages, or any other unit
it can be compared across different settings more easily than many other statistics
Correlation is also always between and , inclusive. That means:
values outside this interval are impossible
a value closer to either endpoint represents a stronger linear association
Interpreting the sign of
The sign of correlation tells the direction of the association.
If is positive, higher values of one variable tend to go with higher values of the other variable.
If is negative, higher values of one variable tend to go with lower values of the other variable.
If is zero, there is no linear association.
The sign does not tell you how strong the relationship is. A correlation of is not weaker than a correlation of just because it is negative. In fact, shows the stronger linear association because its magnitude is farther from .
To compare strength, look at the absolute value of correlation, written as :
larger means a stronger linear association
smaller means a weaker linear association
Interpreting the magnitude of
The magnitude of tells how closely the data follow a straight-line pattern.
Values of close to or indicate a strong linear association.
Values of close to indicate a weak linear association.
There are no universal cutoffs that work in every situation, so your interpretation should be cautious. Words such as weak, moderate, and strong are acceptable, but they should match the size of and the context.
A larger magnitude means the points would be expected to fall more closely around a straight line. A smaller magnitude means the points would be more scattered and less clearly linear.
Special values: , , and
Some values have especially important interpretations.
means a perfect positive linear association. Every point lies exactly on a straight line that rises from left to right.
means a perfect negative linear association. Every point lies exactly on a straight line that falls from left to right.
means no linear association.
The word perfect matters for and . These values mean the data fit a straight line exactly, with no scatter at all.
The phrase no linear association also matters for . It does not justify saying the variables have “no relationship” in every possible sense. Correlation only addresses linear patterns.
Writing a complete interpretation
On AP Statistics questions, a complete interpretation should include:
the direction: positive or negative
the strength: weak, moderate, or strong
the fact that the association is linear
the names of the two variables in context
Good interpretations are specific. Instead of writing “the variables are strongly related,” write that there is a strong positive linear association or a weak negative linear association between the variables named in the problem.
Keep your wording statistical rather than causal. Correlation describes association; it does not by itself show that one variable causes changes in the other.
Common interpretation mistakes
Several errors appear often:
Ignoring the word linear. Correlation measures linear association, so that word should appear in interpretations.
Treating the sign as strength. The sign gives direction, not strength.
Giving units to . Correlation is unit-free, so it should never be reported with units.
Saying means no relationship at all. It means no linear association.
Assuming values near or are perfect. Only exactly or exactly represent perfect linear association.
Accurate interpretation depends on reading both parts of the number: the sign and the magnitude. When both are stated clearly, the meaning of correlation becomes precise and statistically correct.
Practice Questions
A study reports a correlation of between the number of school absences and final course grade.
Interpret this value in context. [2 marks]
1 mark: States the direction correctly: there is a negative association, so students with more absences tend to have lower final grades.
1 mark: States the strength and type correctly: the association is strong and linear.
A researcher examines two quantitative variables and reports the following:
Data set A:
Data set B:
Data set C:
Answer the following. [5 marks]
(a) Which data set shows the strongest linear association? Explain. [2 marks]
(b) What does the negative sign in data set B tell you? [1 mark]
(c) What does in data set C tell you, and what can you not conclude from it? [2 marks]
(a)
1 mark: Identifies data set B.
1 mark: Explains that is closer to than , so it has the strongest linear association.
(b)
1 mark: States that as one variable increases, the other tends to decrease.
(c)
1 mark: States that means there is no linear association.
1 mark: States that this does not prove there is no relationship of any kind.
FAQ
Correlation is based on how standardized values move together, not on the original units.
If you convert inches to centimeters or minutes to seconds, every value is multiplied by a positive constant. That changes the scale, but not the overall linear pattern.
Because of this, $r$ stays the same under unit changes like:
feet to inches
pounds to kilograms
Celsius to Fahrenheit
No. Correlation is symmetric.
That means the correlation between variable $X$ and variable $Y$ is the same as the correlation between $Y$ and $X$.
So:
the numerical value of $r$ does not change
the sign does not change
the strength interpretation does not change
This is different from some other statistics, where choosing an explanatory or response variable matters.
Yes, but it is uncommon.
It happens only when all data points lie exactly on a single straight line:
$r=1$ for a perfectly increasing line
$r=-1$ for a perfectly decreasing line
In real data, measurement error and natural variability usually prevent perfect alignment. That is why most real correlations are close to, but not exactly, $1$ or $-1$.
Correlation reduces a full scatterplot to one number, so some visual information is lost.
Two data sets can share the same $r$ but differ in:
how tightly points cluster in different regions
whether there are gaps or clusters
whether the pattern is influenced by a small number of points
So identical correlation values do not guarantee identical-looking data sets.
Not always. Descriptions such as weak, moderate, and strong depend partly on context.
A value like $0.50$ may be interpreted differently depending on:
the field of study
how much natural variation is expected
how the statistic will be used
In some settings, $0.50$ may be quite meaningful. In others, it may be viewed as only modest evidence of linear association. Context helps determine the most appropriate wording.
