
AP Syllabus focus: 'The predicted response value, y-hat, is calculated from the regression equation using the y-intercept, slope, and explanatory variable value.'
A regression line allows you to turn an explanatory-variable value into an estimated response. In AP Statistics, calculating predicted values means using the regression equation carefully, matching notation correctly, and reporting the estimate in context.
What a Predicted Value Represents
In a simple linear regression setting, the model gives an expected response for each chosen value of the explanatory variable. That expected response is called the predicted response value and is written as , read as “y-hat.” It comes from the regression line, not from directly observing the data point.
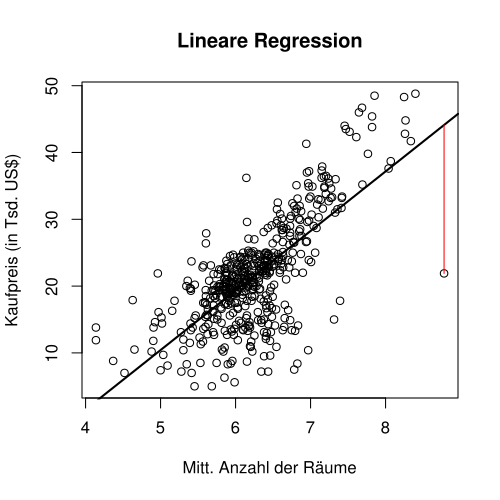
A scatterplot with a fitted regression line illustrates how each -value maps to a predicted response value on the line. The accompanying residual plot shows the vertical differences between observed values and their predictions, reinforcing that predictions come from the model rather than direct observation. Source
Predicted response value: The estimated value of the response variable produced by the regression equation for a given explanatory-variable value.
Predicted values are useful because they turn a fitted regression model into a practical estimating tool. Once the equation is known, the explanatory value named in the problem can be substituted to obtain the model’s estimate of the response.
The Regression Equation
A regression equation for AP Statistics is commonly written in a simple linear form. The equation combines a fixed starting amount with a change based on the explanatory variable.
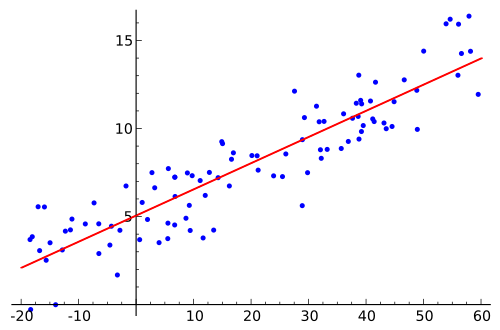
This scatterplot with an overlaid regression line highlights the core structure of simple linear regression: the line’s intercept sets a baseline, and the slope determines how the predicted response changes as increases. Visually, the regression line represents the set of predicted values across the range of explanatory-variable values. Source
= predicted response value
= y-intercept of the regression line
= slope of the regression line
= explanatory variable value
When you calculate a predicted value, you are not solving for an unknown slope or intercept. Those numbers are already given by technology or by the problem. Your job is to substitute the correct -value and carry out the arithmetic accurately.
How to Calculate a Predicted Value
To calculate , follow a consistent process:
Identify the regression equation exactly as given.
Locate the explanatory variable value that should be substituted for .
Substitute that value into the equation in place of .
Apply order of operations carefully, including any negative values or decimals.
State the predicted response with appropriate context and units.
Each part of the equation has a specific role:
The y-intercept is the constant term. It is the starting value in the equation before any change due to is included.
The slope tells how much the predicted response changes for each one-unit increase in the explanatory variable.
The explanatory variable value is the particular input you are using to generate the prediction.
Because the regression equation is a model, the predicted value should be described as an estimate or prediction, not as an exact observed outcome. That wording matters in statistical communication.
Reading Different Forms of the Equation
Not every textbook, calculator, or software package uses the same symbols. You may see the regression equation written as or as . These forms mean the same thing:
or is the y-intercept.
or is the slope.
is still the explanatory variable value.
is still the predicted response.
The notation can vary, but the calculation process does not change. The key is to match the coefficient attached to with the slope and keep the constant term as the intercept.
It is also important to distinguish from .
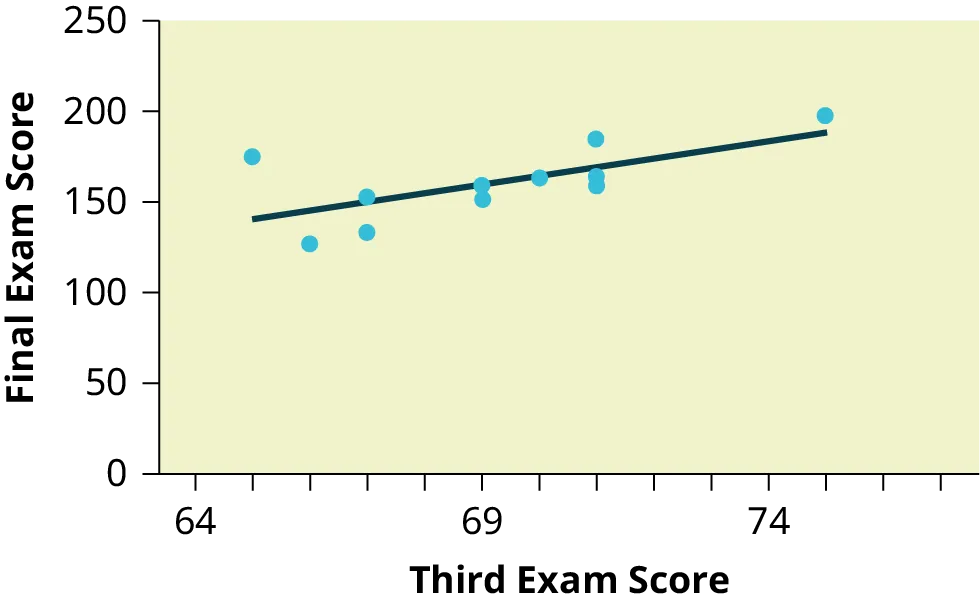
This OpenStax figure demonstrates how a line of best fit is drawn through a scatterplot to generate predicted values for given -values. The highlighted point-and-line comparison helps students see the difference between an observed response and its model-based prediction. Source
The symbol usually refers to an actual observed response value, while refers to the model’s predicted response for a given explanatory value.
Writing Predictions Clearly
On an AP Statistics question, a correct number is important, but a complete answer usually needs statistical language as well. A predicted value should be communicated as a statement about the response variable for a specified value of the explanatory variable.
A strong written prediction usually does three things:
identifies that the value is predicted or estimated
names the response variable
includes the correct units, if units are part of the context
For example, if the response variable measures time, cost, score, or percentage, the predicted value should be reported in those response-variable units. The units of are used for substitution, but the final prediction is always in the units of .
Precision also matters. If the regression equation includes decimals, keep enough digits during computation so that rounding does not distort the final prediction. Then round the final answer in a reasonable way that matches the context or the directions given.
Common Errors to Avoid
Several common mistakes can lead to incorrect predicted values even when the regression equation is given correctly.
Substituting into the wrong variable: only the explanatory value replaces .
Using the wrong coefficient as the slope: the slope is the number multiplying .
Forgetting the intercept: the constant term must be included in the calculation.
Ignoring negative signs: a negative slope or negative explanatory value changes the arithmetic.
Reporting the answer as an observed value: it is a prediction from the model.
Using the units of for the answer: the predicted value uses the units of the response variable.
Calculator fluency helps, but conceptual accuracy matters just as much. If you can identify the regression equation, recognize the role of each term, and substitute the explanatory value correctly, you can calculate predicted values reliably in AP Statistics problems.
Practice Questions
A regression equation is given by . Find the predicted response when .
1 mark for substituting into the equation
1 mark for the correct predicted value,
A teacher uses a regression model to predict quiz score, , from hours of practice, . The regression equation is .
(a) Calculate the predicted quiz score for a student who practices 3 hours.
(b) Calculate the predicted quiz score for a student who practices 6.5 hours.
(c) Explain what the value from part (a) means in context.
Part (a): 1 mark for correct substitution, 1 mark for correct prediction
Part (b): 1 mark for correct substitution, 1 mark for correct prediction or
Part (c): 1 mark for stating that is the model’s predicted quiz score for a student who practices 3 hours
FAQ
It means the predicted response for the $i$th individual or case in the data set.
The subscript helps match each predicted value to a specific observation when software lists many predictions at once. For example, $\hat{y}_3$ is the predicted response for the third data point.
Yes, but only approximately.
Reading from a graph can give a rough estimate of the predicted response, but it is usually not exact enough for a final AP Statistics answer. If the equation is available, use it for the precise prediction.
Most graphing calculators and software let you store the regression equation as a function.
Then you can enter different $x$-values and evaluate the function to get $\hat{y}$. This is especially useful when several predictions must be found from the same regression model.
Not always.
A regression model can produce decimal predictions even when the response counts items or people. Those decimals can represent an average predicted outcome. Whether to round depends on the context and the directions in the question.
Yes.
A linear model is a mathematical rule, so it can sometimes give predictions such as negative time, negative height, or a value outside a realistic range. That does not automatically mean the arithmetic is wrong; it means the model’s prediction may not fit the context well.
